Live exec dashboard
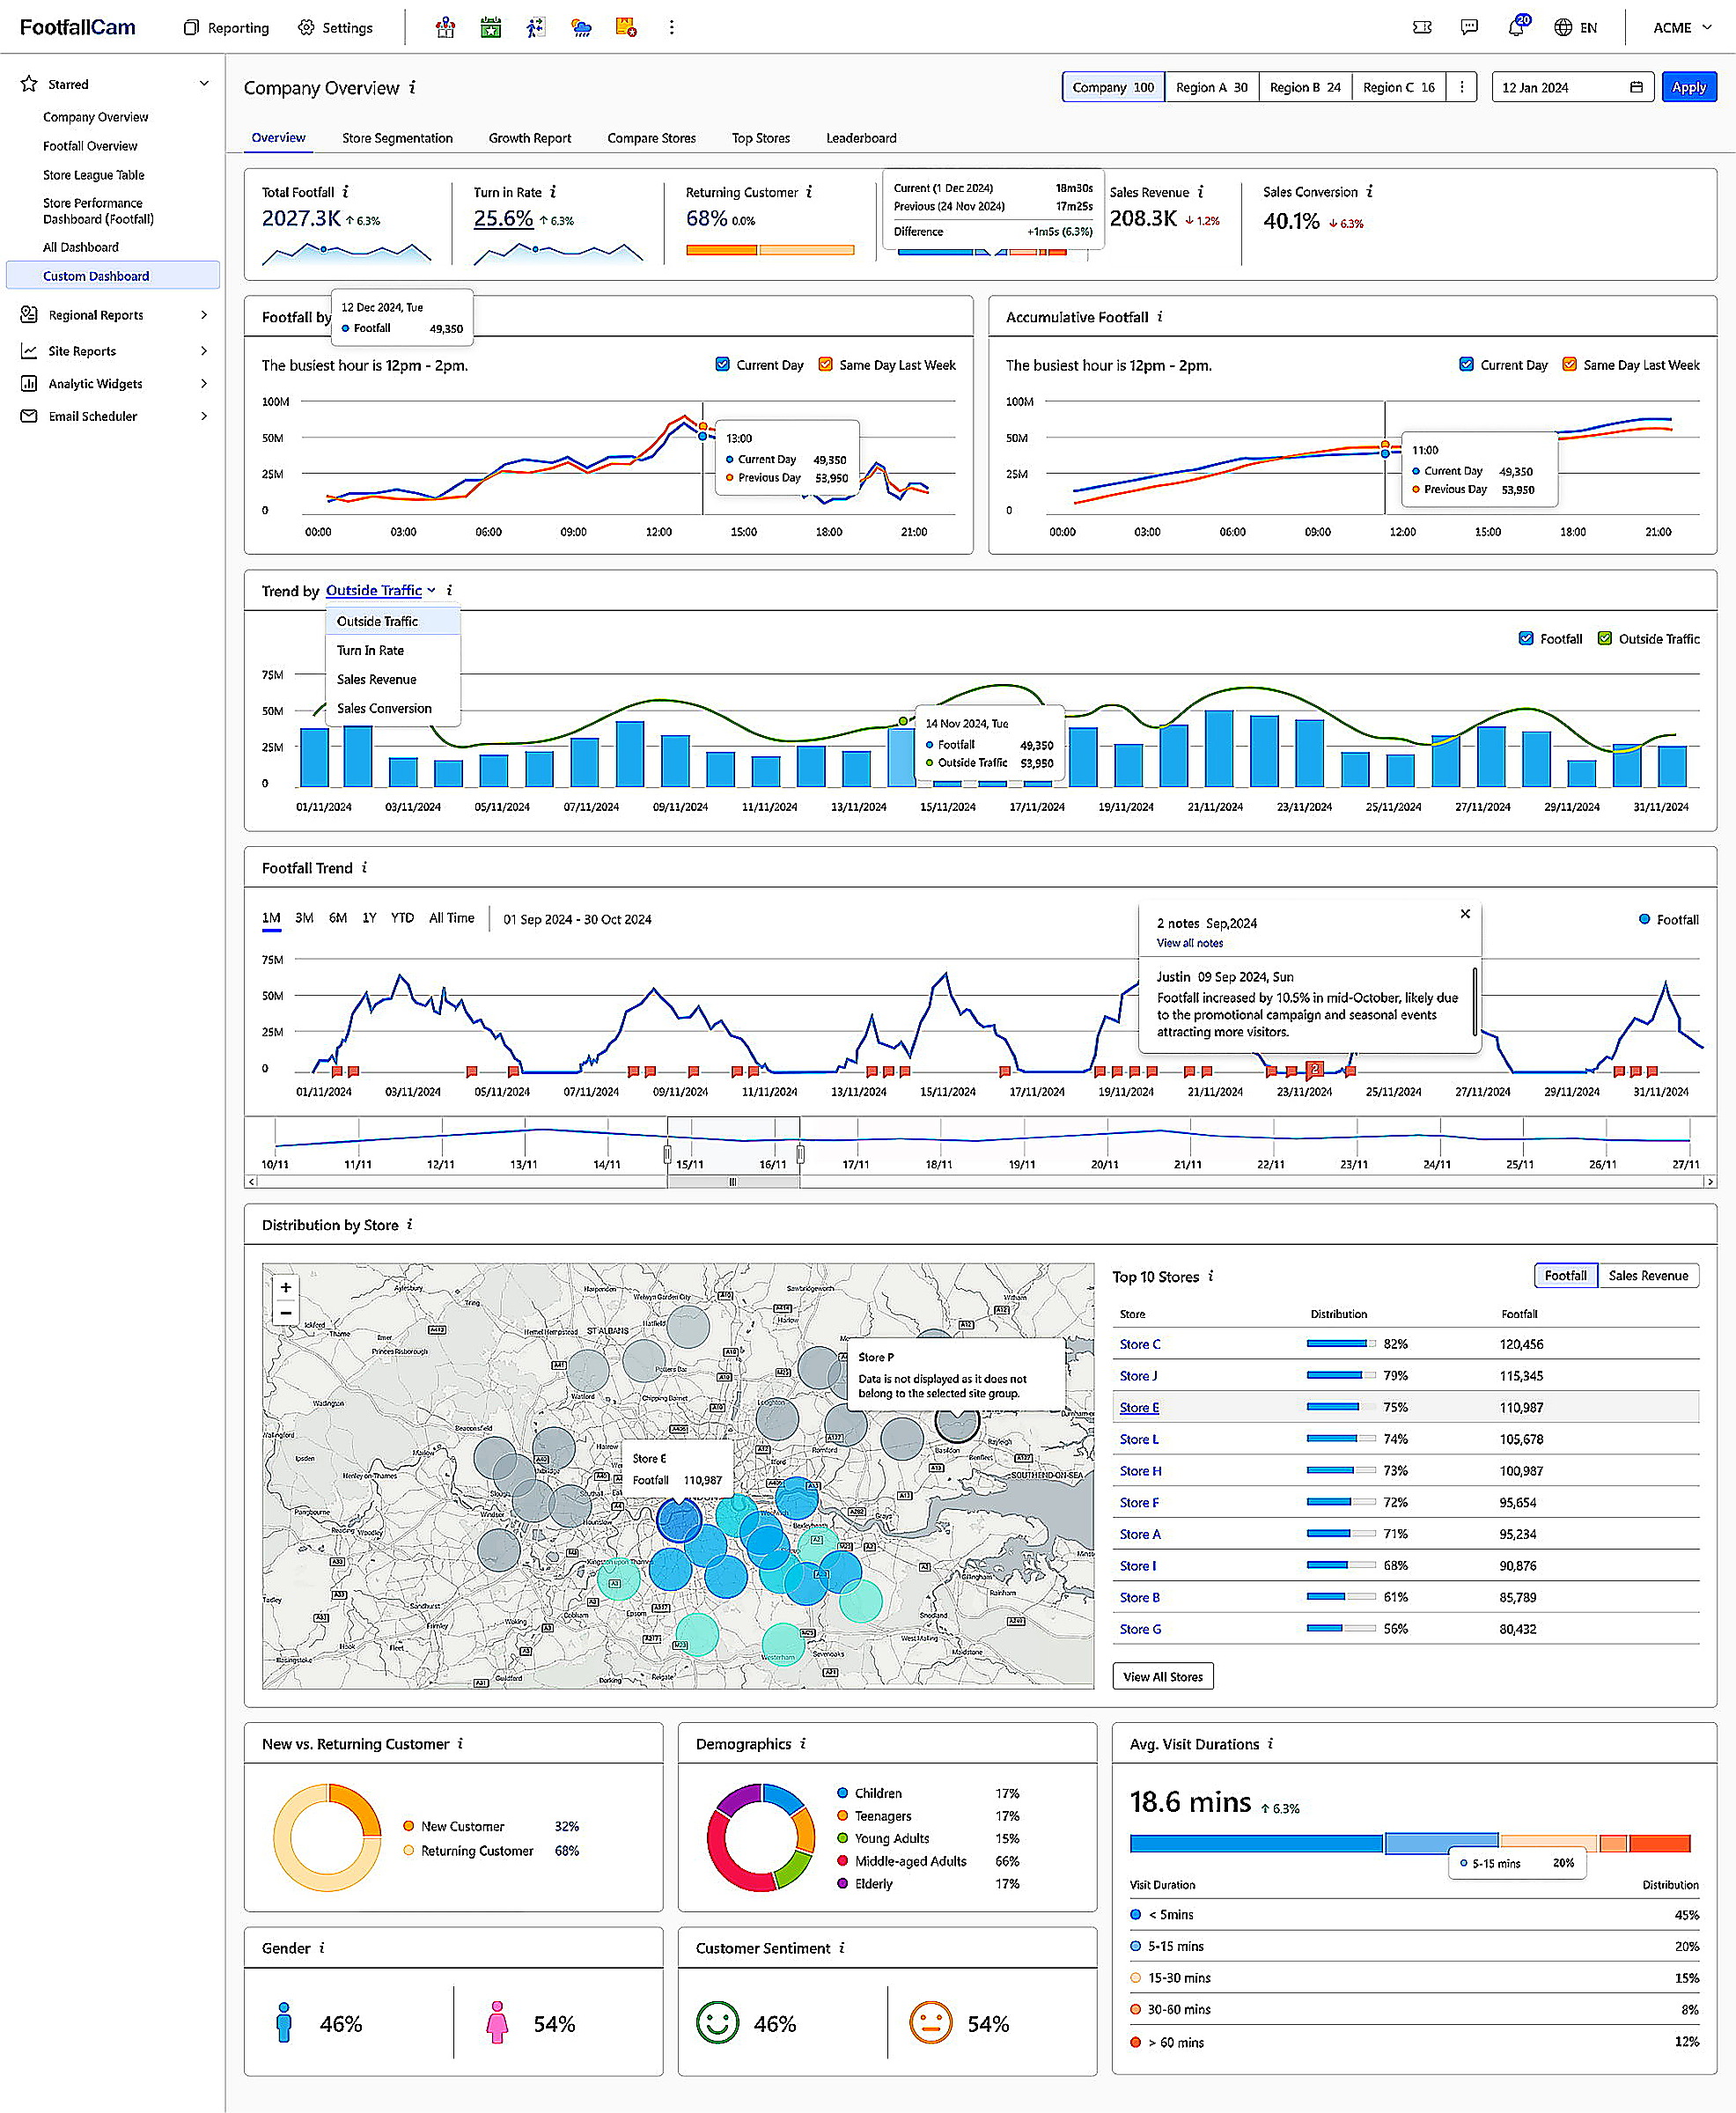
Company overview dashboard
Full operational picture in one screen: live footfall, turn-in rate, returning customers, sales revenue, conversion, store-by-store distribution and customer demographics.
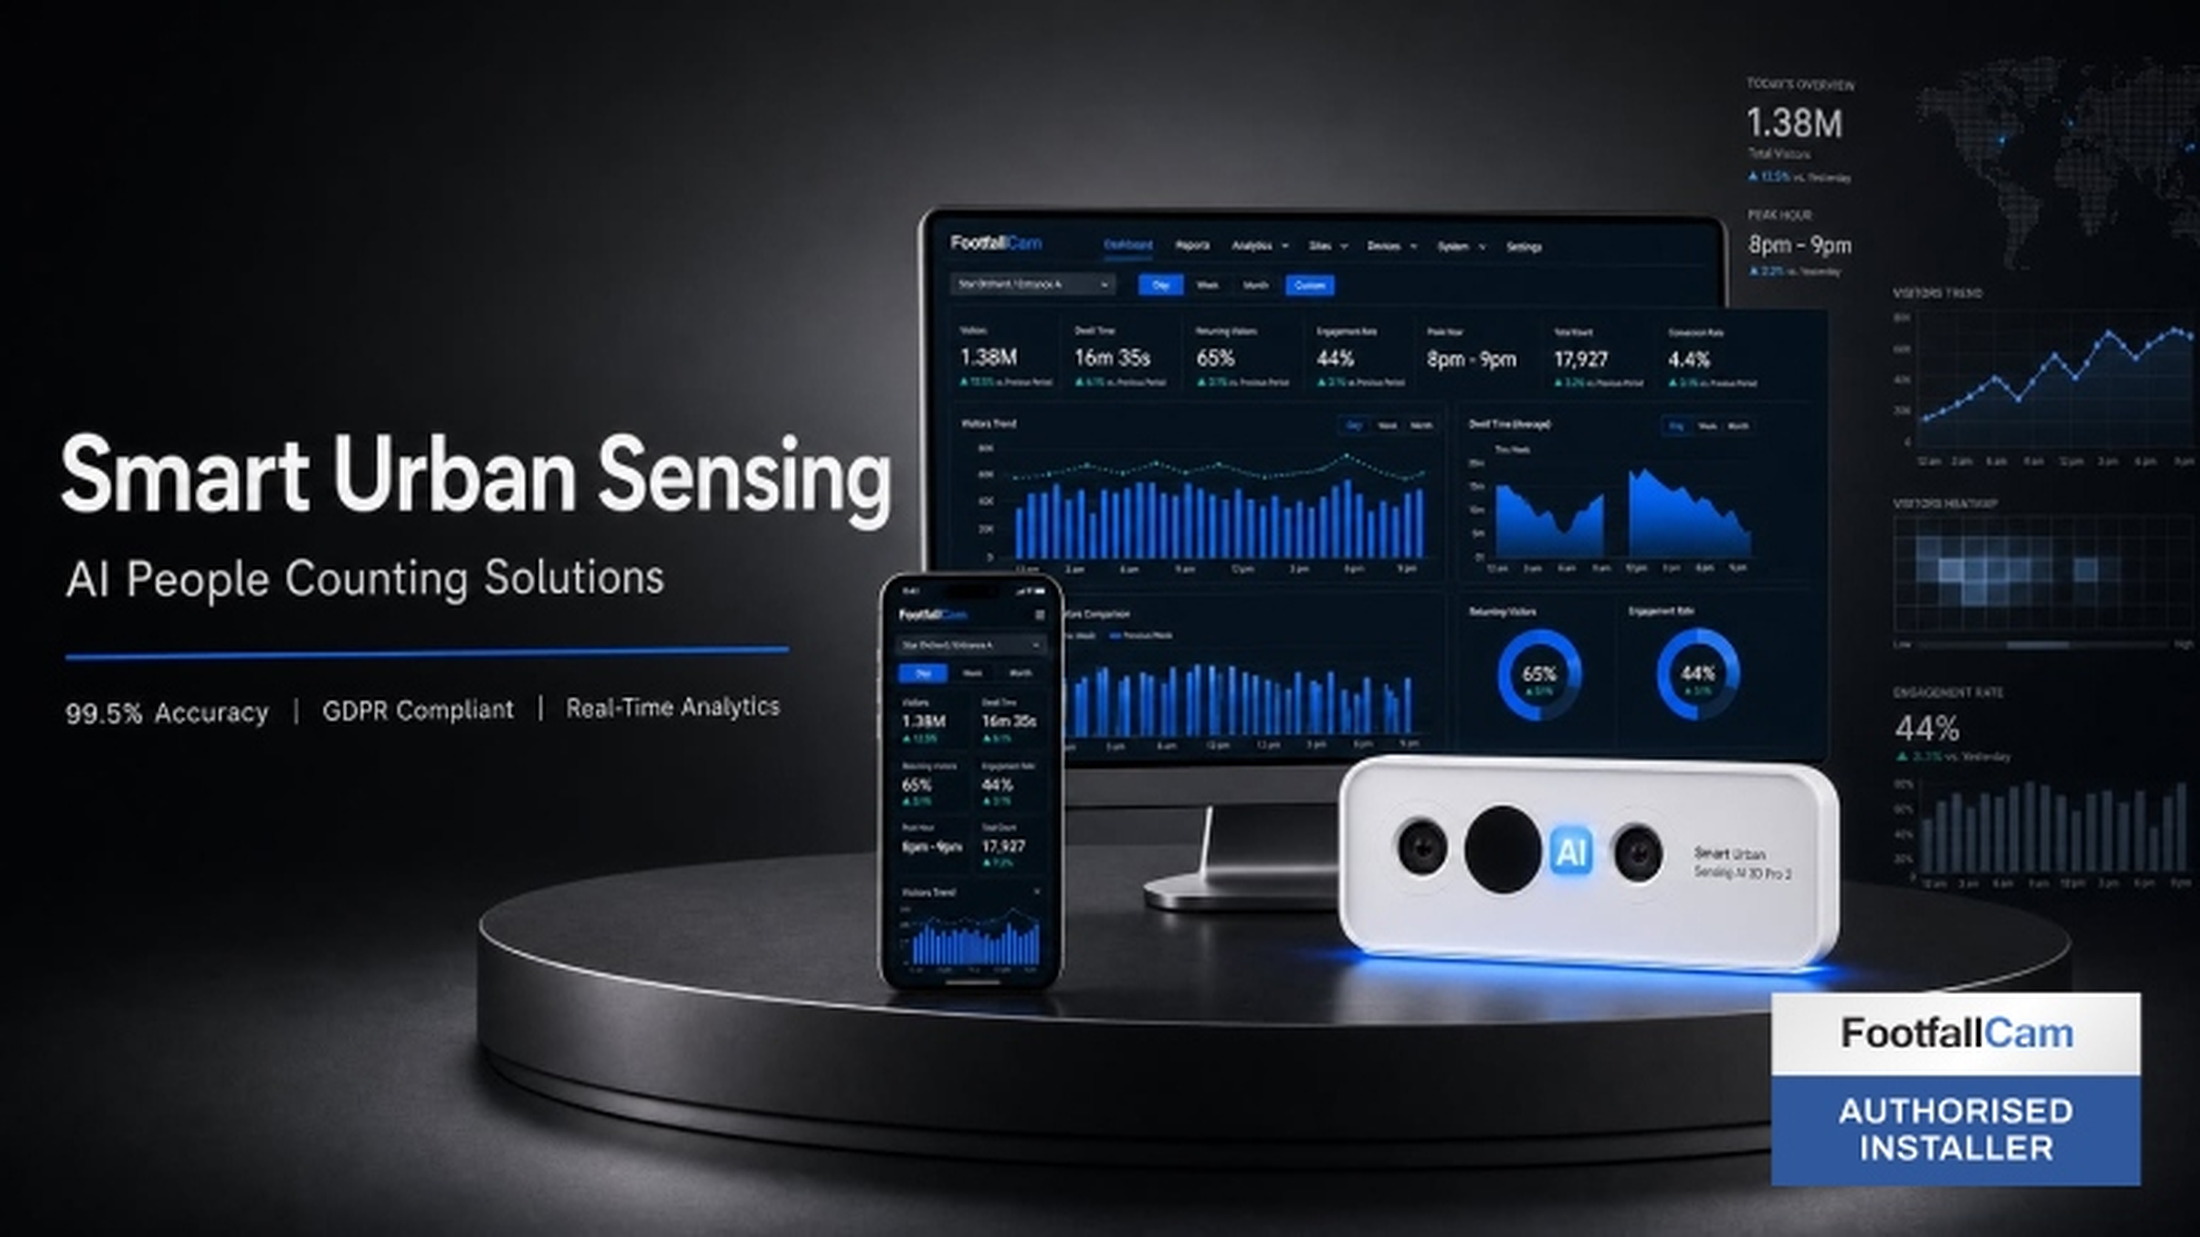
99%-accurate people counting, conversion analytics and zone-level engagement — deployed and supported across UK and international retail by the Smart Urban Sensing team.

Live screens from the SUS FootfallCam V9 platform — the same software that sits behind Pandora, The Body Shop, HARIBO and the rest of the retail brands trusting Smart Urban Sensing. Real reports, real numbers, no mockups.
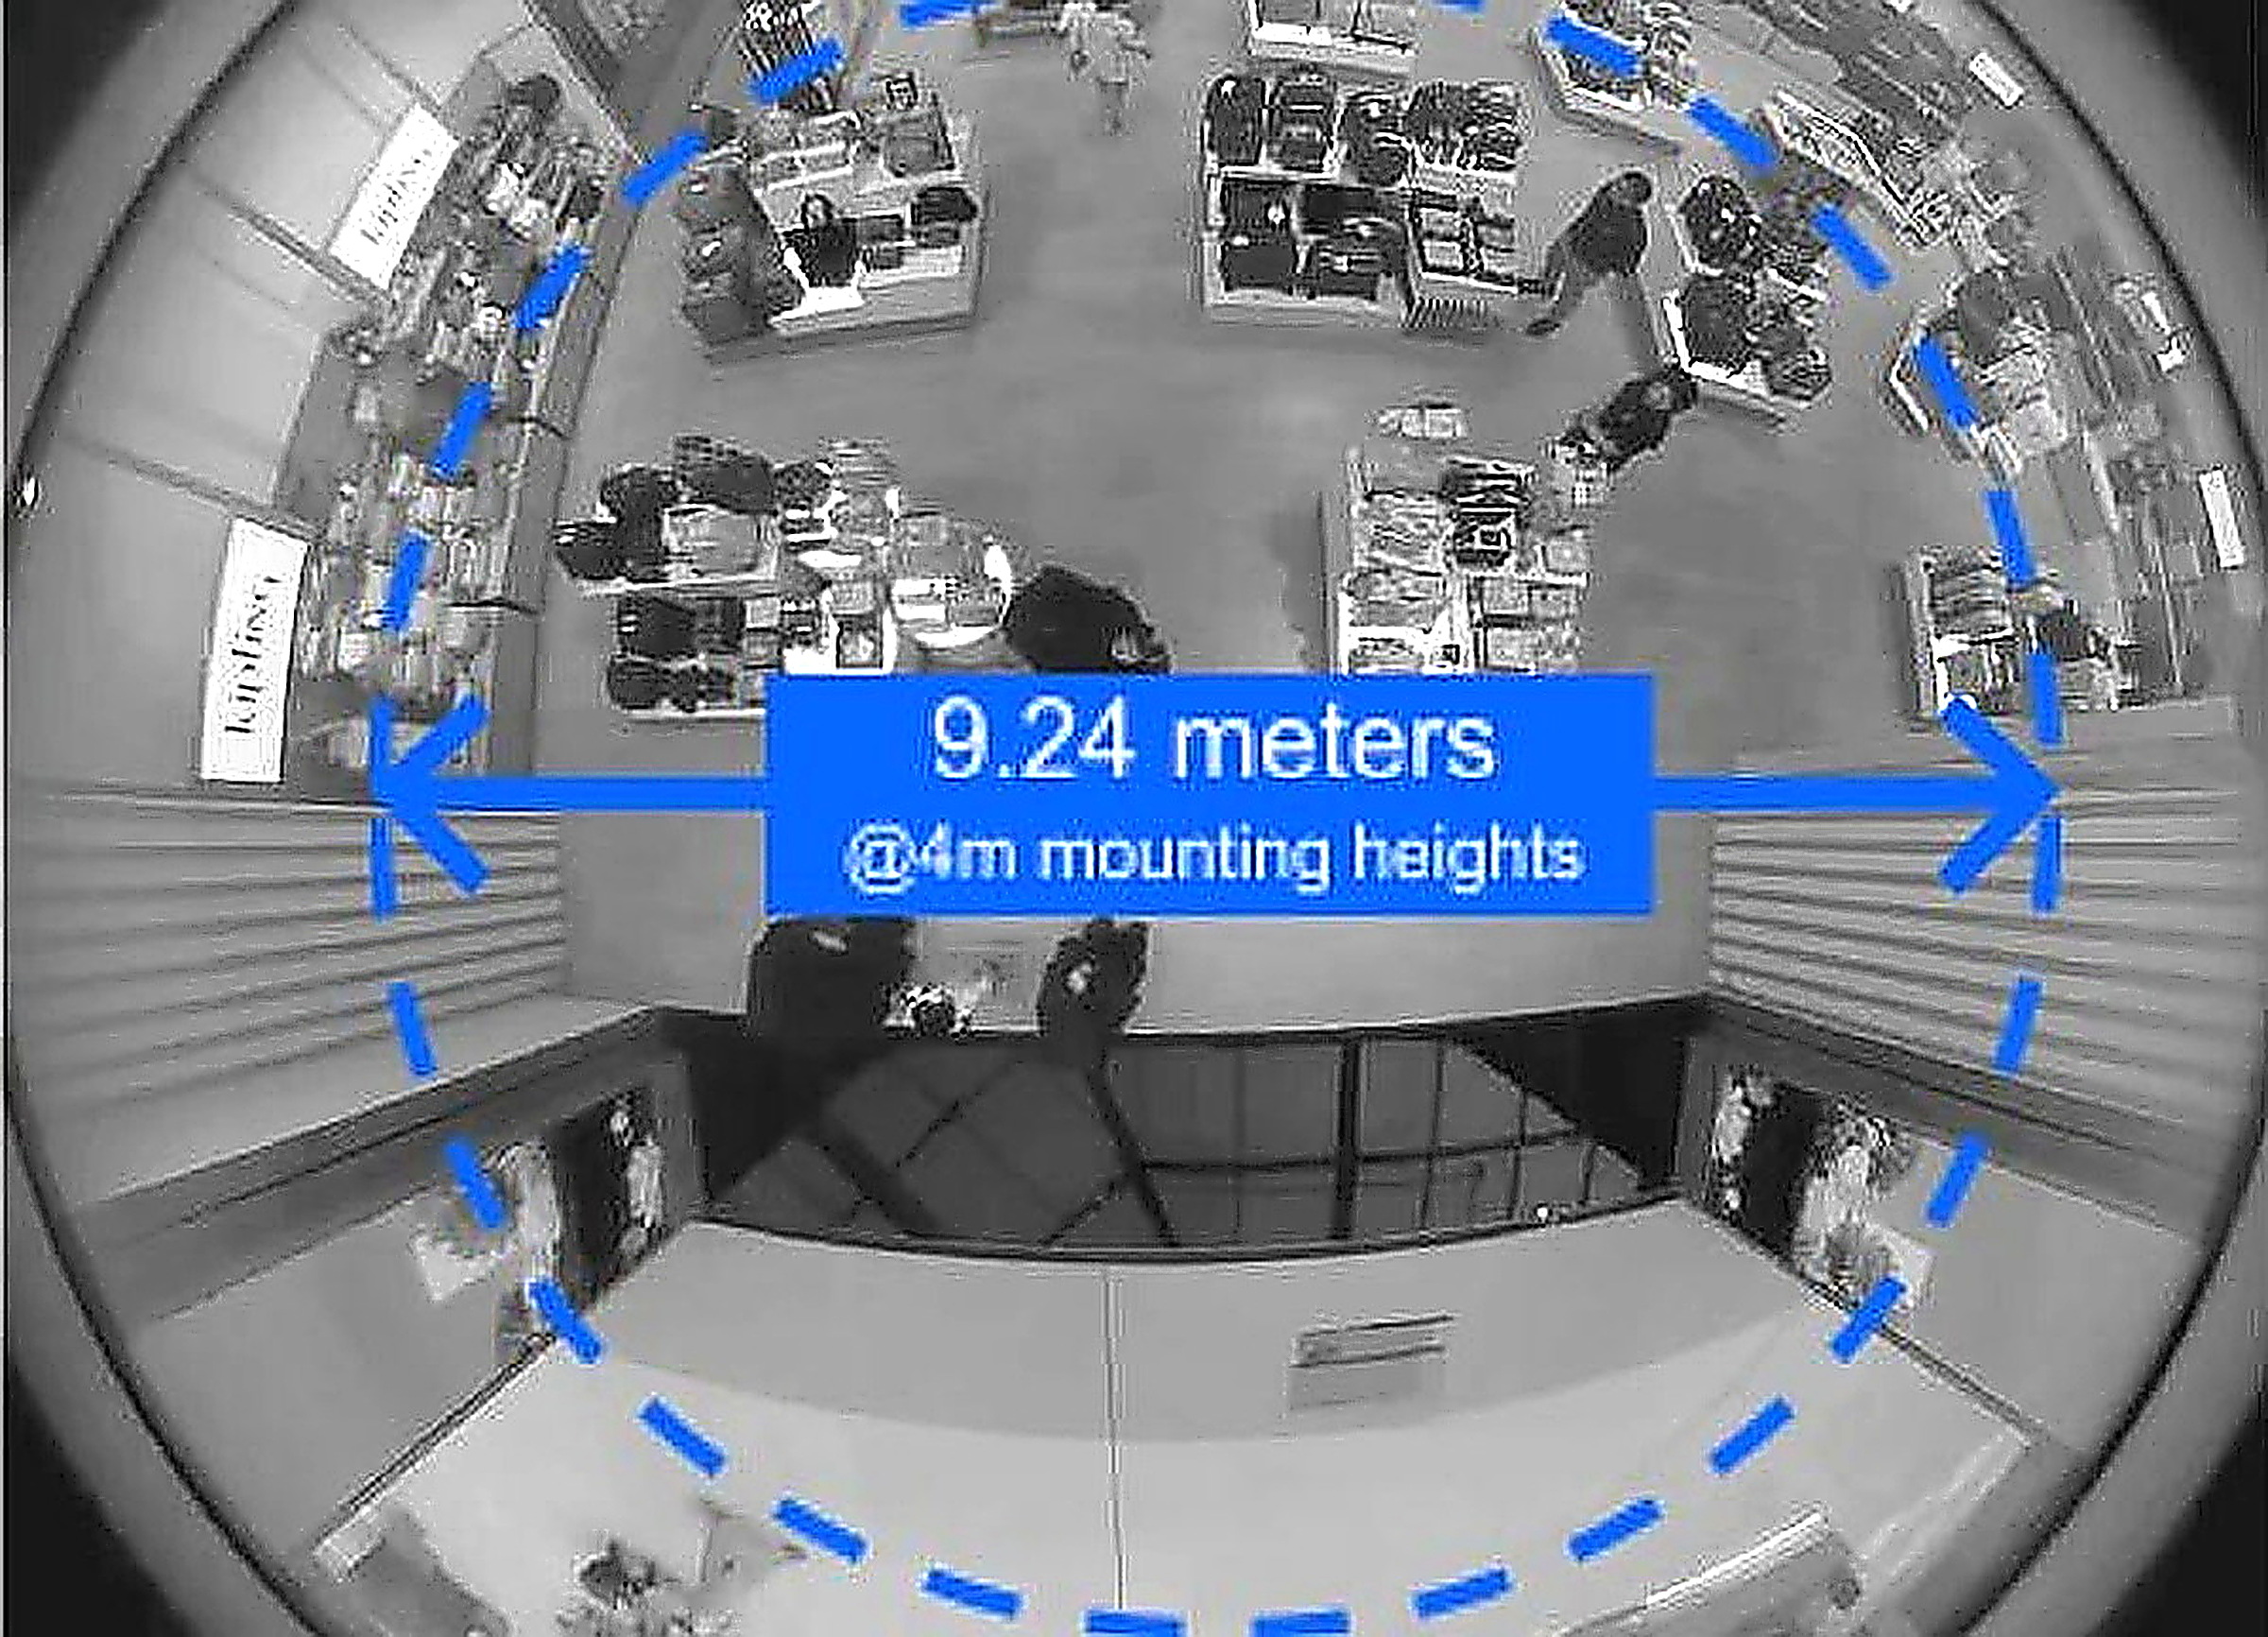
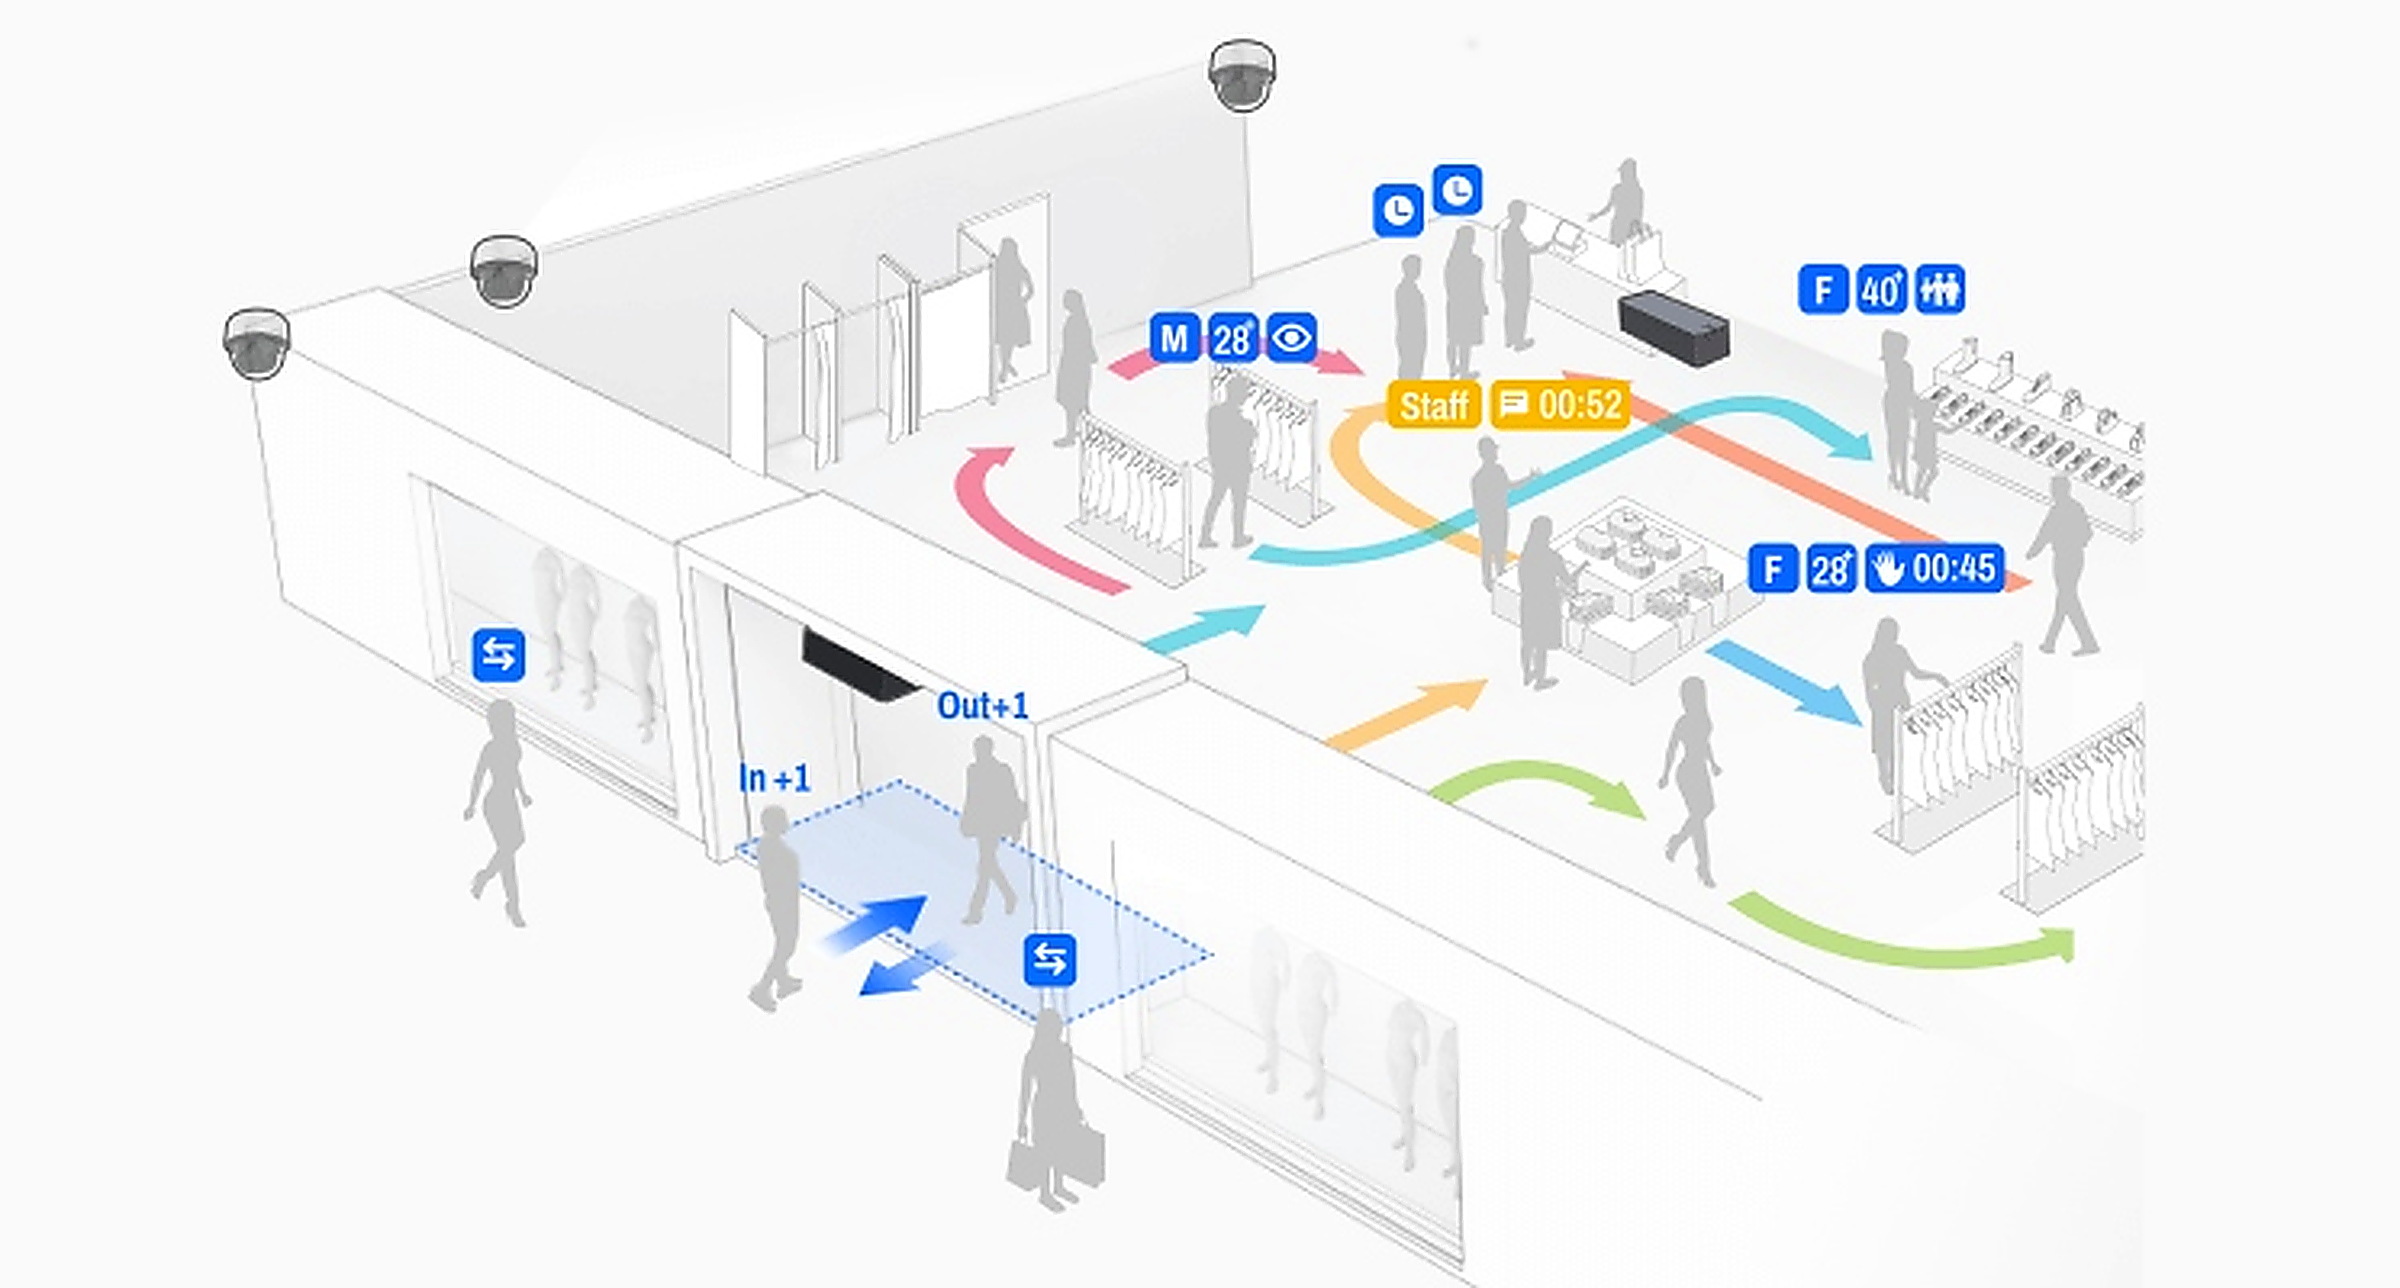
Wide-angle, top-down sensing covers a single sales floor with fewer devices, lower install cost and a cleaner ceiling. Every visitor inside the dashed footprint is counted, tracked and attributed in real-time — the same data that powers every report further down this page.
Real dashboards from the SUS FootfallCam platform — operational overview, weekly conversion ranking and trend analytics. The outputs commercial buyers ask to see before they sign.
Full operational picture in one screen: live footfall, turn-in rate, returning customers, sales revenue, conversion, store-by-store distribution and customer demographics.
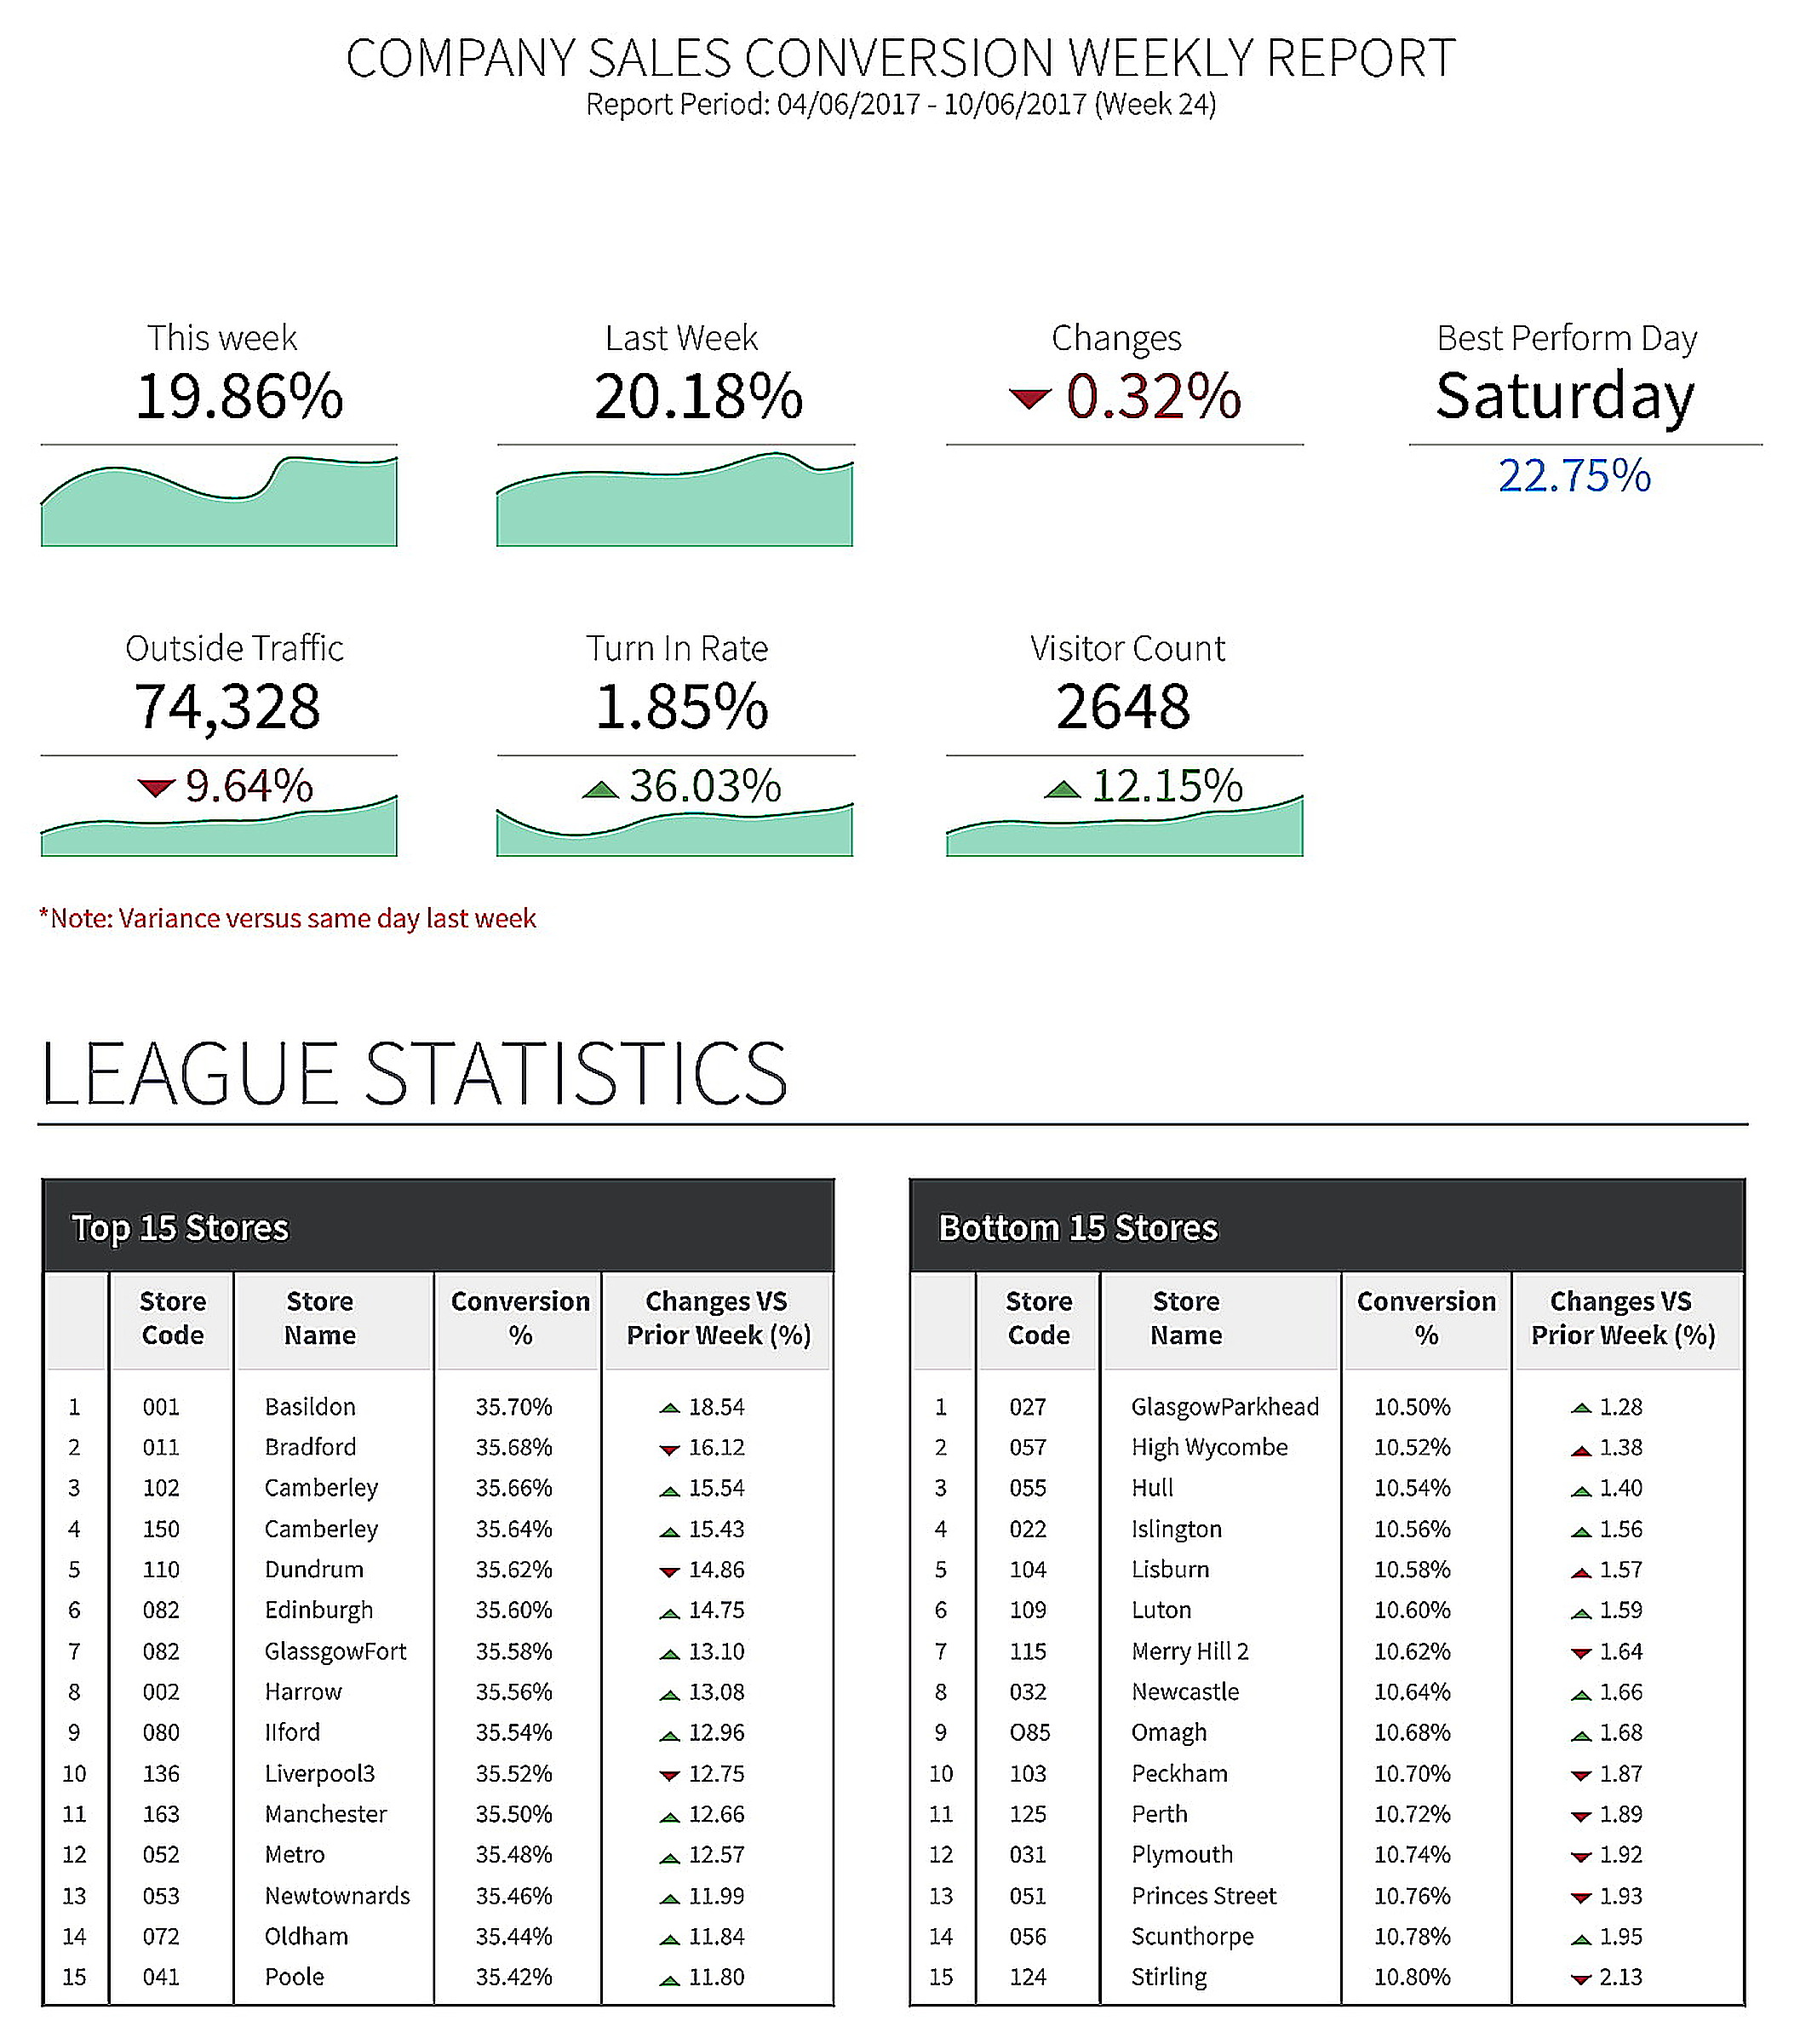
Top 15 and bottom 15 stores ranked by conversion, with week-over-week change. Lets head-office spot the wins to replicate and the underperformers that need attention.
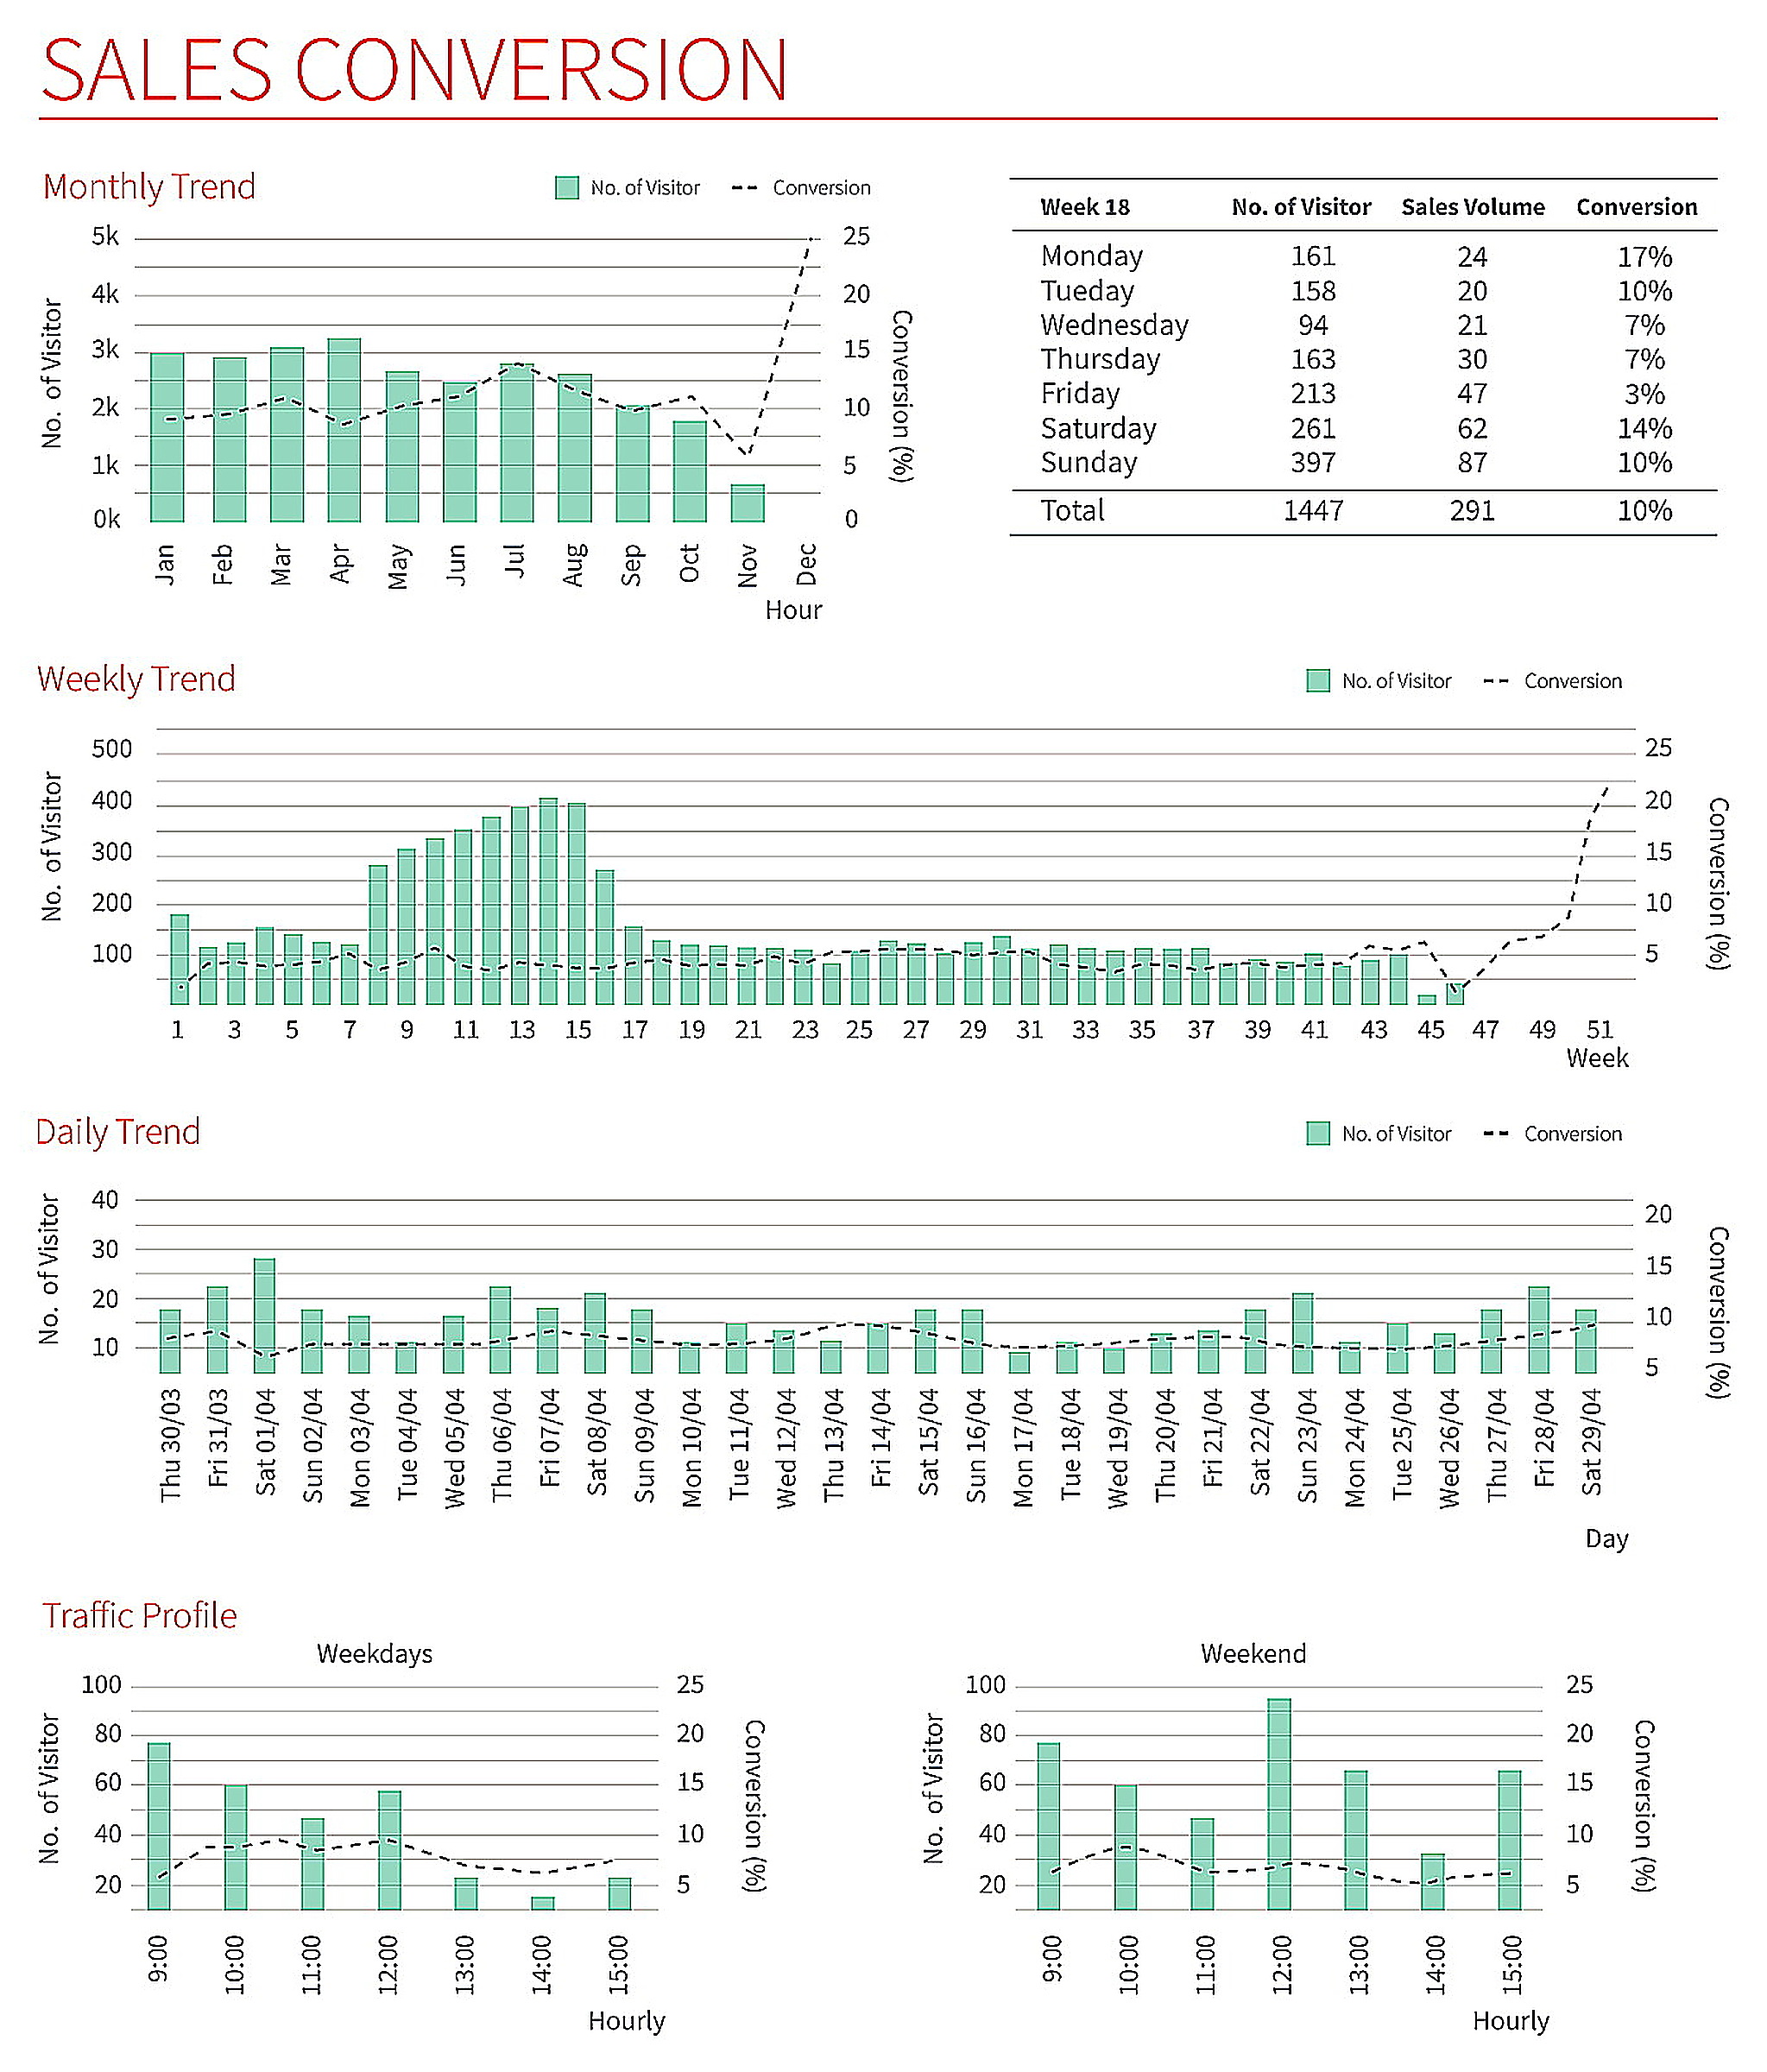
Monthly, weekly, daily and hourly conversion patterns with weekday vs. weekend traffic profiles — the rhythms you need for staffing, marketing and merchandising calls.
The SUS AI 3D Pro1, 3D Pro2 and 3D Pro3 — the hardware behind every Smart Urban Sensing installation. Discreet ceiling and wall mounts, fanless silent operation, on-device AI and anonymous-by-design counting that’s GDPR-ready out of the box.
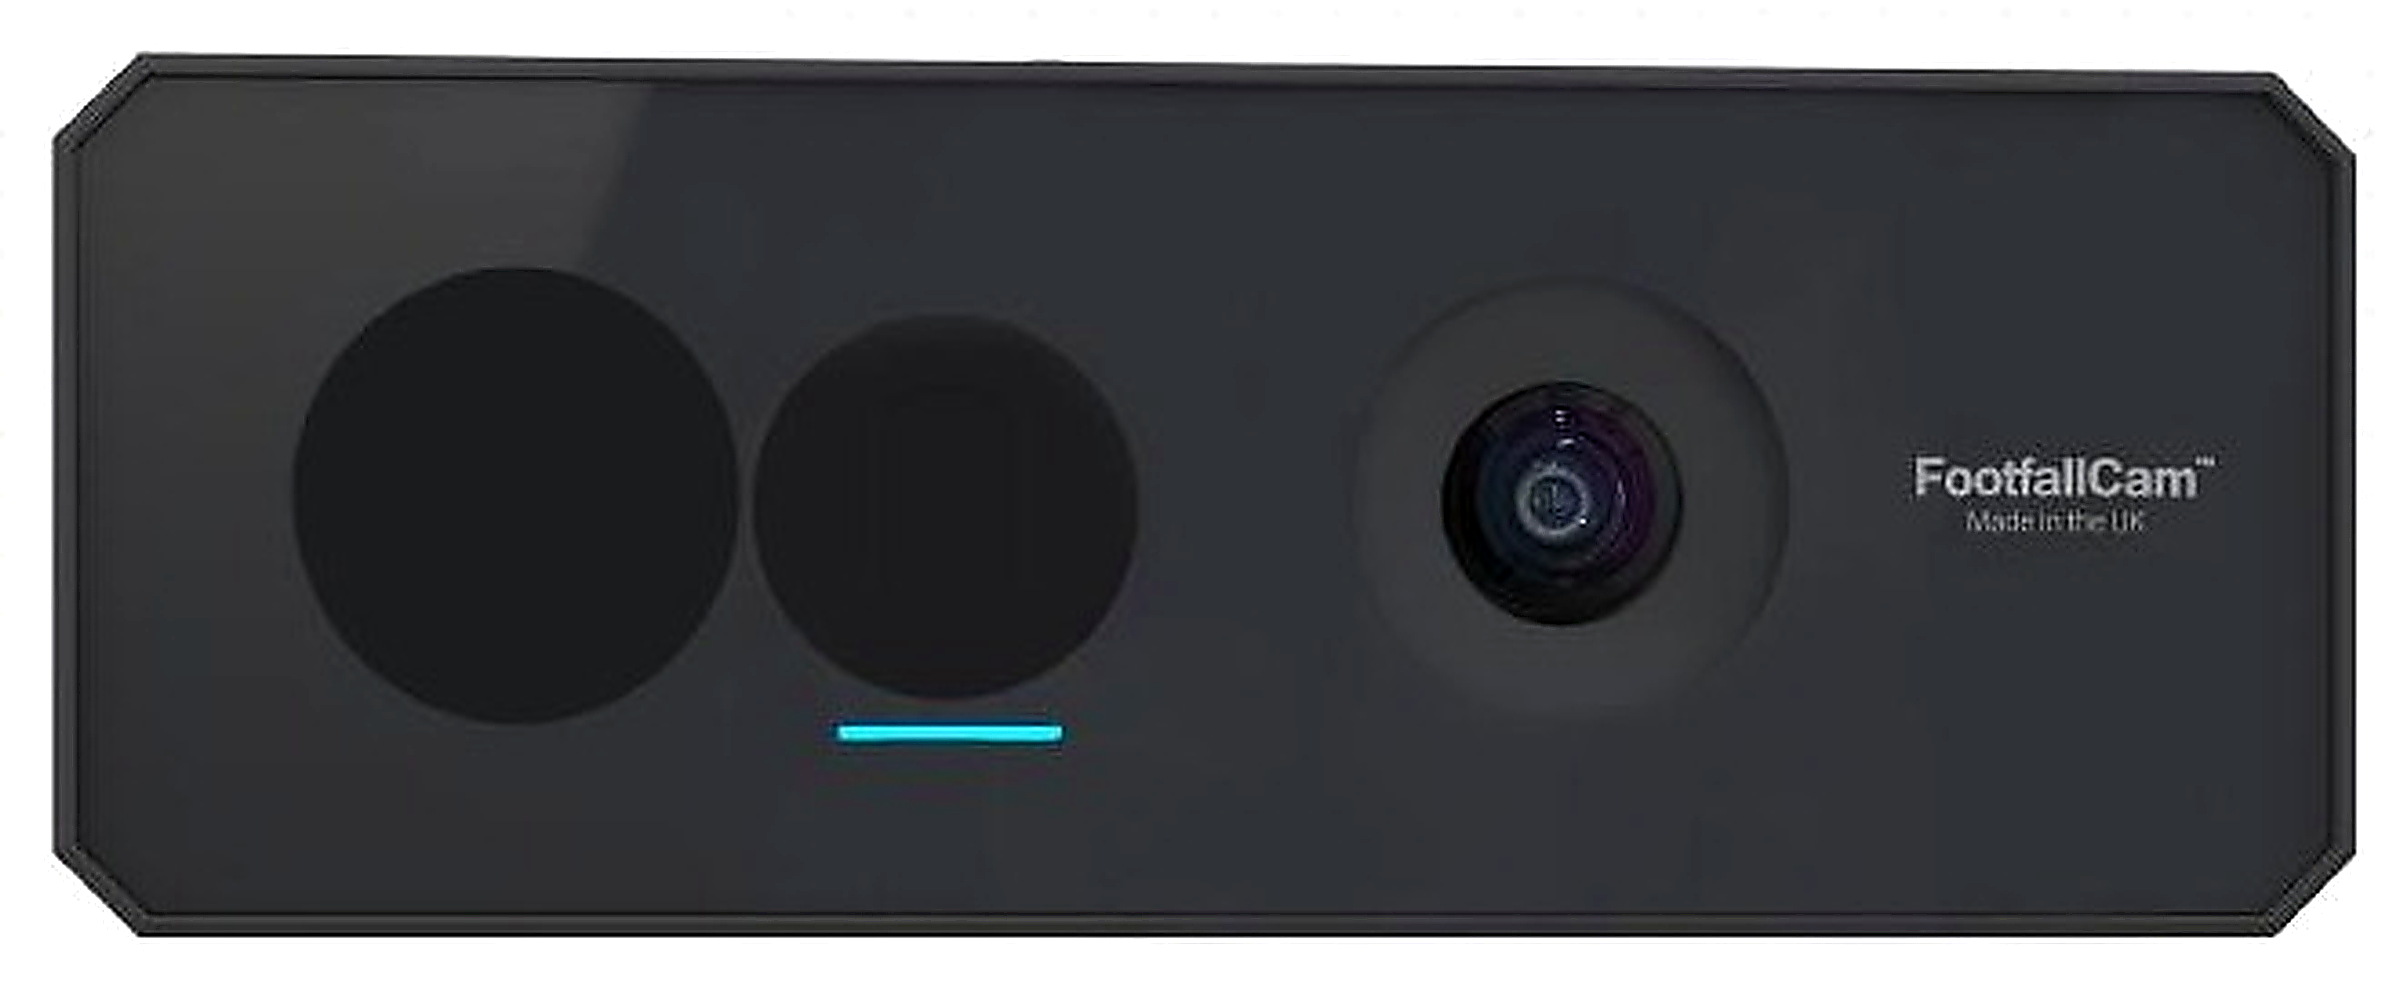
Compact, ceiling-mounted 3D stereo sensor with on-device AI counting and a quiet status LED. The go-to device for single entrances, smaller stores and cost-efficient multi-site rollouts.
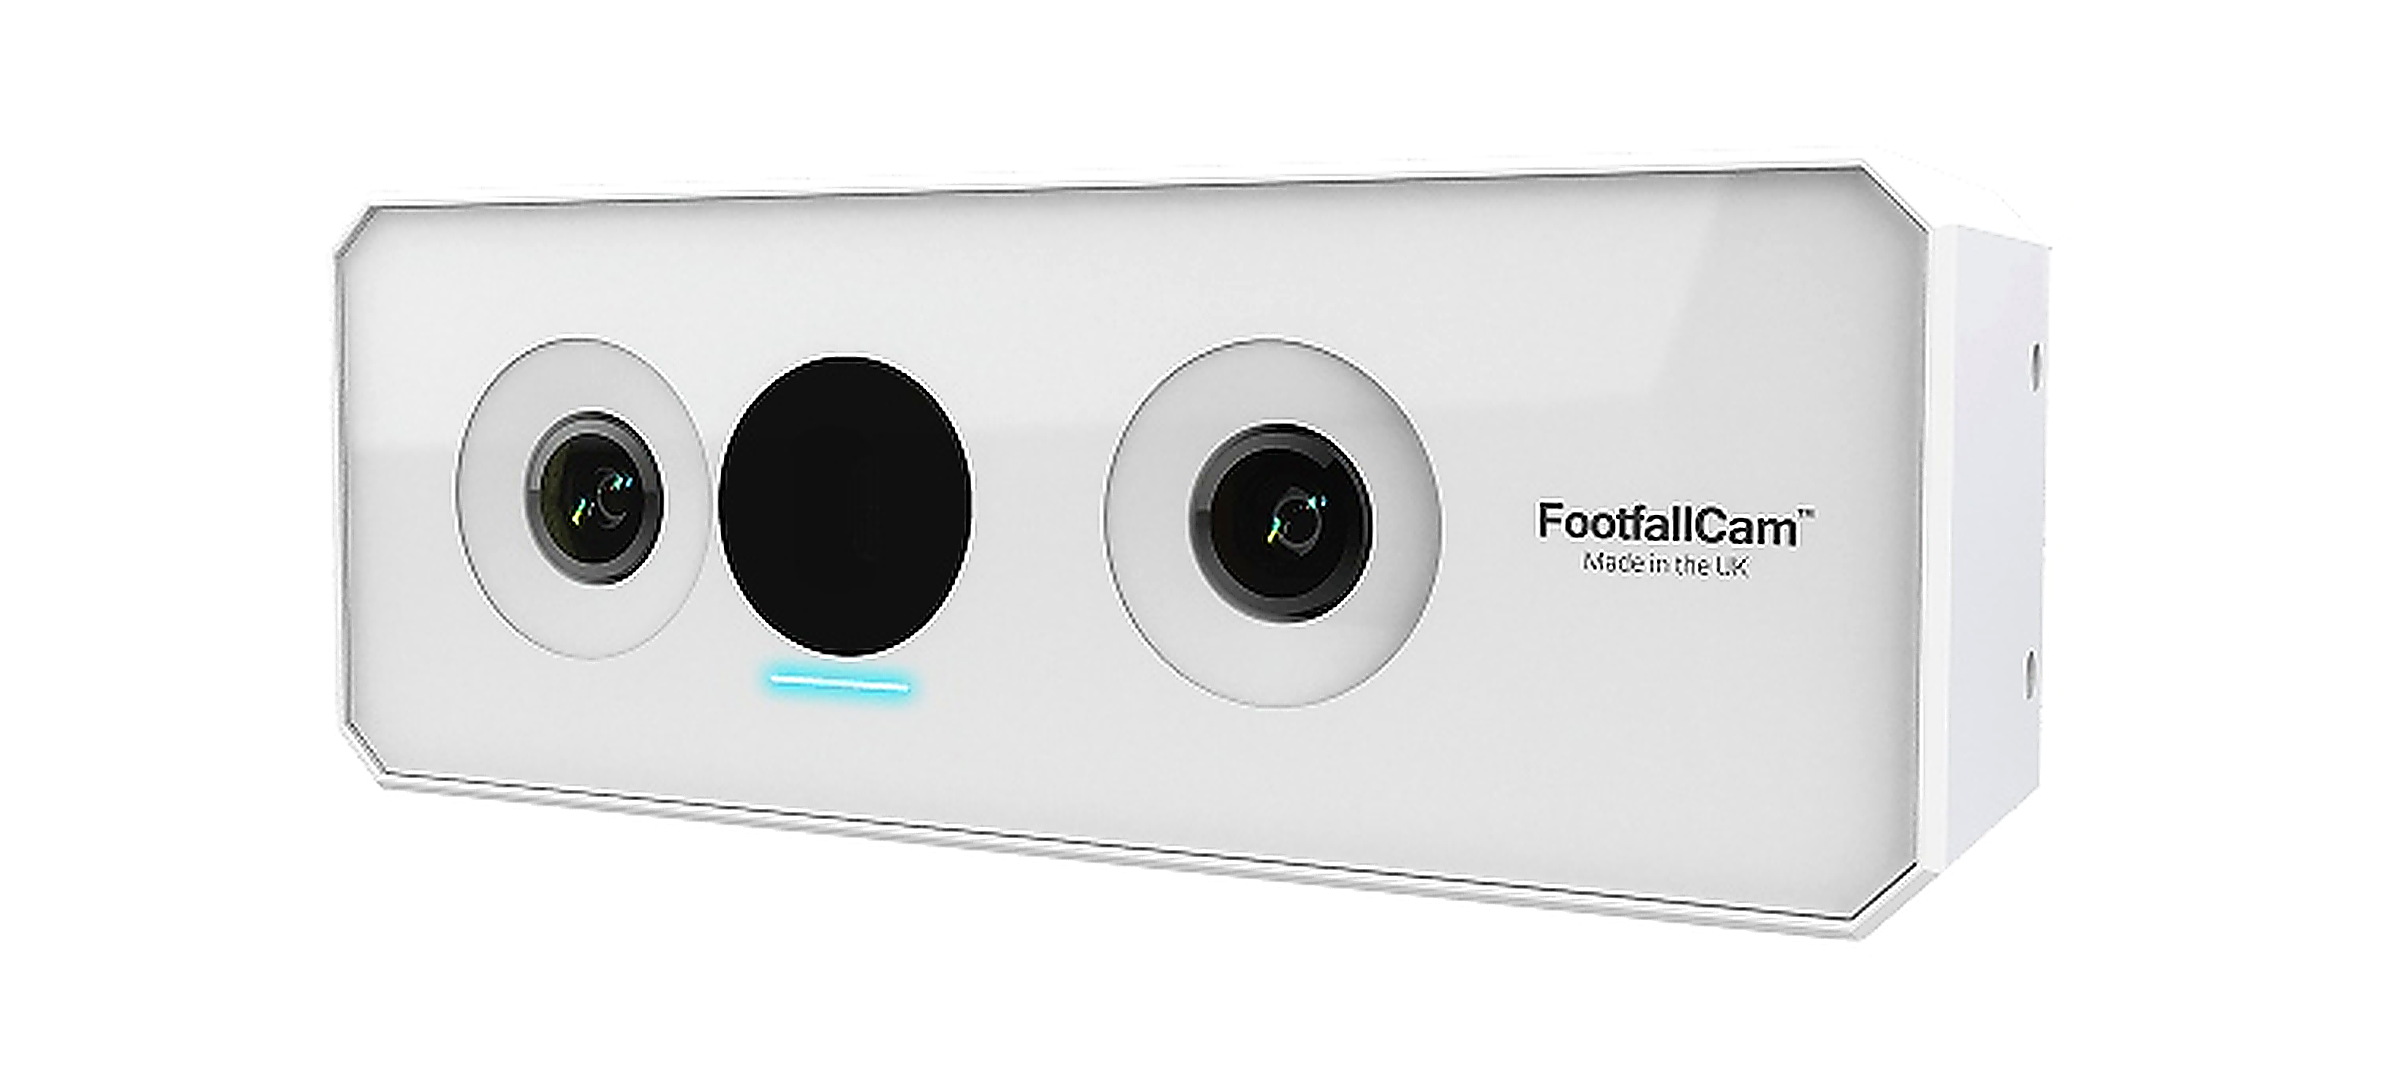
Dual-lens 3D stereo vision with advanced AI counting, demographics and zone analytics. Up to 9.24 m coverage from a single device at 4 m mount height — fewer sensors, cleaner ceilings, lower install cost.
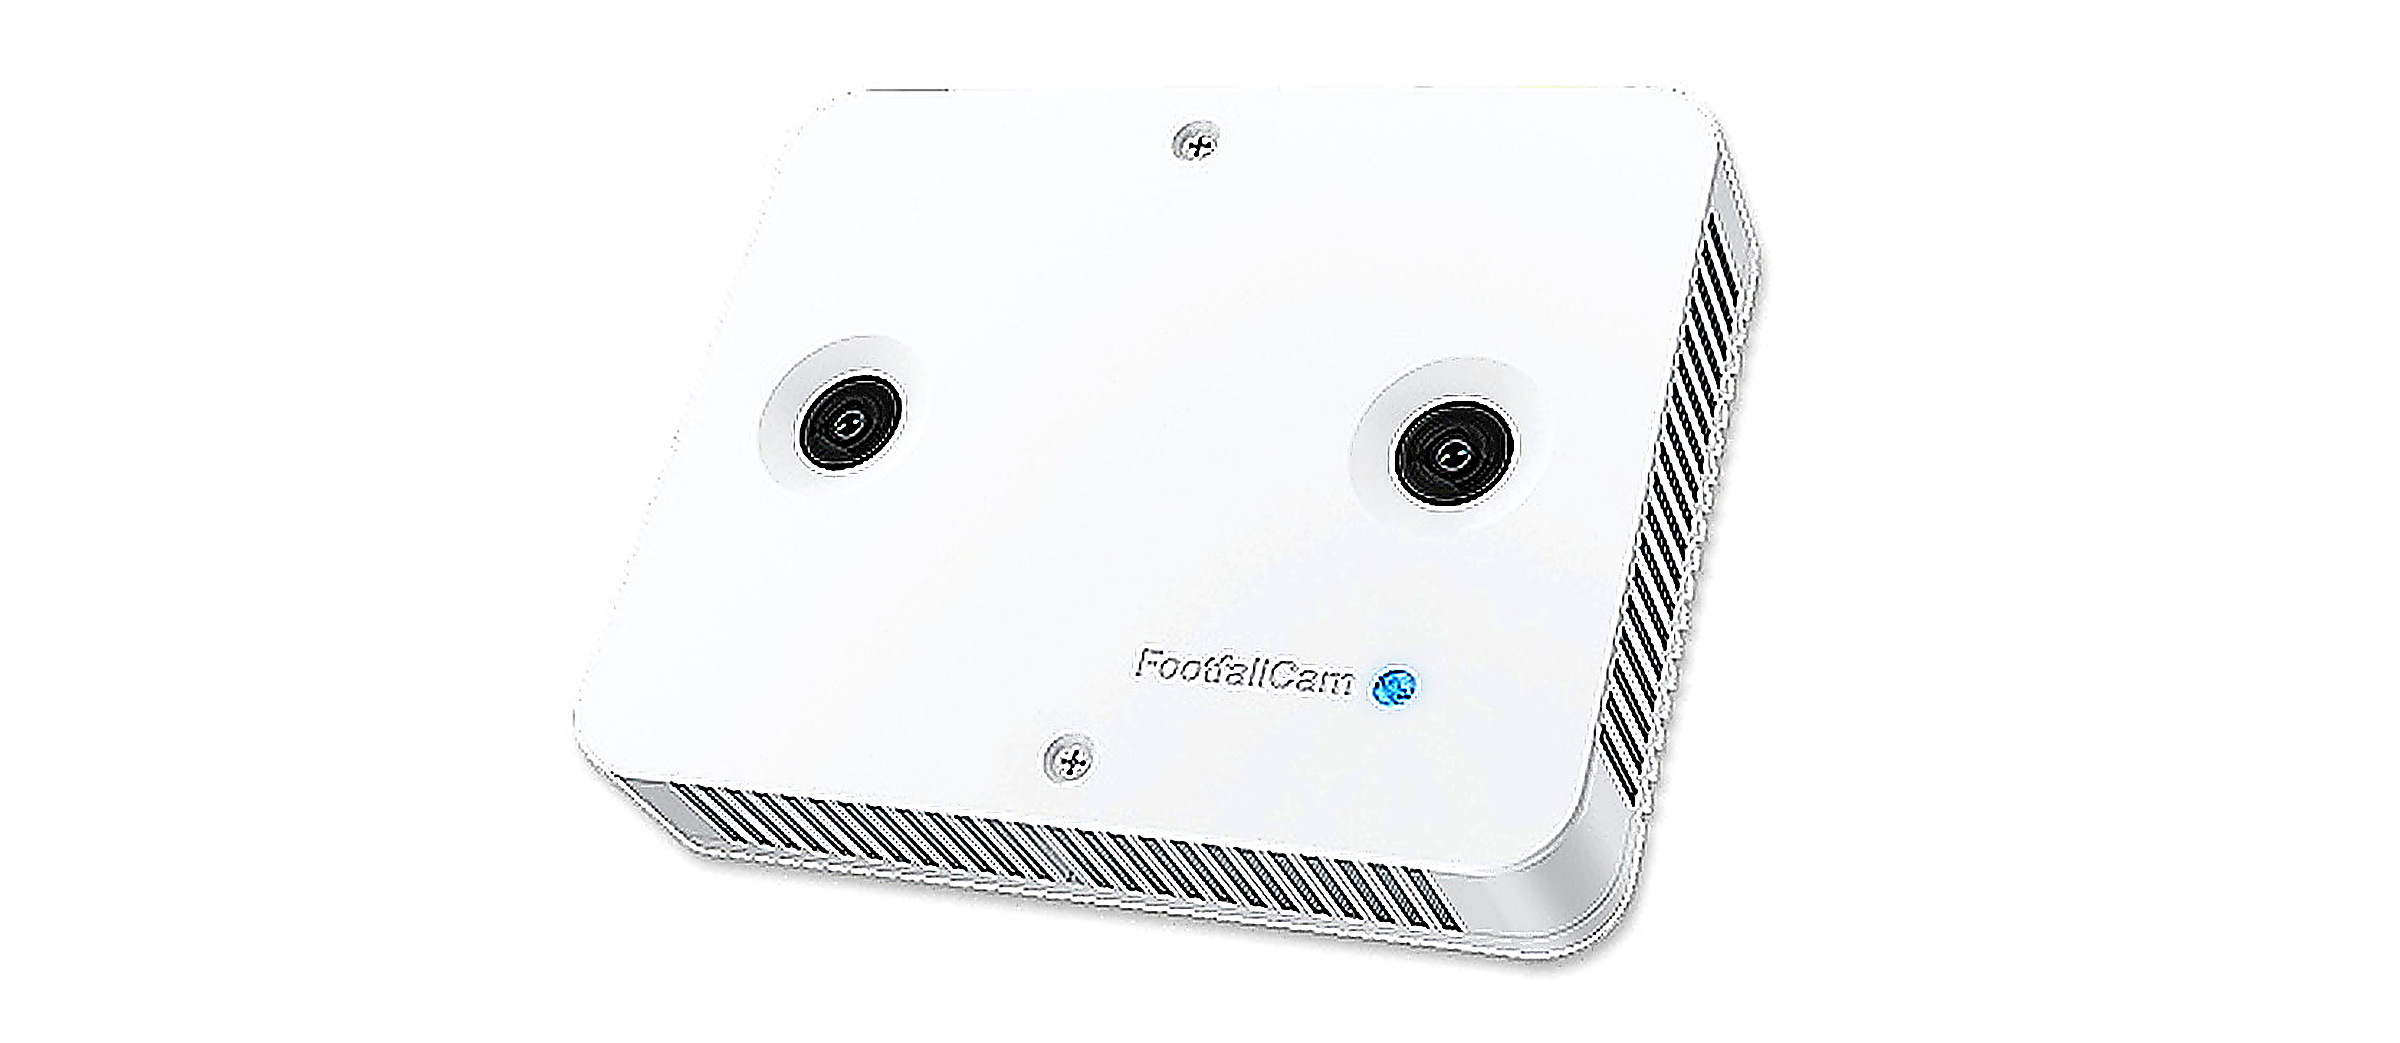
The SUS AI 3D Pro3 AI box: on-device AI processing, dual-lens stereo vision, anonymous-by-design counting and silent fanless housing — engineered for permanent retail deployment and years of uninterrupted retail-grade service.
Zone-level engagement plotted directly onto the store floor plan, with demographics breakdown and per-zone engagement scores. This is the merchandising conversation buyers want — backed by anonymous, GDPR-safe data.

Average and max occupancy, occupancy-limit alerts and minutes-over-limit per day. 15-minute live trend, an hour-by-day occupancy heatmap and a full summary table — everything centre managers need to manage capacity, safety and dwell time.

Site identity, operating hours, location map, visitor totals, group sizes, average visit duration and busiest hours — with this-year vs. last-year visitor trend over 120 days on a single screen.

The dashboard mall and shopping-centre operators ask to see first. Comparable year-on-year visitor data, group-size analysis, dwell-time benchmarks and the busiest-hour insights that drive tenant-mix, staffing and marketing decisions.
The same sensors that count your visitors also map how they move through the store: dwell by zone, pathing between displays, group composition and queue dynamics — the behavioural layer that makes merchandising and layout decisions defensible.
This is the report that closes the deal. Total revenue up 13% to $1.543M, visitor count up 23%, and the Top 10 stores ranked side-by-side for visitor count, sales revenue and conversion. One screen — the full commercial case for the platform.

We design, install, integrate and support people-counting programmes for UK and international retail brands — from a single flagship to multi-site rollouts. End-to-end delivery, retail-grade SLAs and a dedicated UK helpdesk.
Every installation we deliver is a retail store, flagship or chain — not a one-off project. The reporting, KPIs and SLAs are tuned for store managers, area managers and head office.
Authorised SUS FootfallCam installer with direct factory support, the latest SUS AI 3D Pro1, 3D Pro2 and 3D Pro3 hardware, and the V9 platform — the same platform Pandora rolled out across 200+ UK & Ireland stores.
Manchester-based team, nationwide engineers, full survey-to-go-live delivery and ongoing UK helpdesk. No offshore queues for retail-critical sites.
A selection of UK and international retail brands using SUS FootfallCam people-counting and conversion analytics through Smart Urban Sensing and the wider SUS FootfallCam network.
Pandora replaced its legacy Prism™ people counters with SUS FootfallCam, rolling out 200+ devices across its UK and Ireland estate to standardise traffic, conversion and benchmarking reporting across stores.
SUS FootfallCam people counting deployed across high-street locations — visitor volumes, dwell time and store-by-store conversion benchmarking feed weekly performance reviews for store and area managers.
SUS FootfallCam sensors deployed in HARIBO outlet retail to measure visitor traffic, peak hours and conversion against EPOS data — informing staffing rotas, promotional planning and outlet performance benchmarking.
UK premium menswear brand using SUS FootfallCam people counting to measure store-front conversion, dwell time and the impact of in-store events and campaigns on flagship and high-street stores.
Specialist home-improvement retailer using SUS FootfallCam to measure showroom traffic, sales-team conversion per visitor and the ROI of regional marketing — clear visibility on where each lead came from and how it converted.
UK fragrance retailer using SUS FootfallCam across multiple stores to power a weekly conversion league table, identify top performers, surface under-performers early and standardise traffic reporting for head-office reviews.
Brand references shown for context of the SUS FootfallCam platform deployed by Smart Urban Sensing and the wider partner network. Programme details vary by client; figures shown are platform capabilities and where stated represent publicly disclosed deployments.
Once visitor traffic is measured accurately and linked to EPOS sales, retailers consistently surface the same commercial levers. These are the conversion uplift areas SUS FootfallCam clients use to build the ROI case.
Example: a global retailer extended trading hours after SUS FootfallCam revealed high after-hours mall traffic at a flagship — +4% conversion uplift attributable to the change.
When staffing rotas, layout and campaigns are aligned to actual visitor traffic, retailers commonly see double-digit revenue lift at top-performing stores within the first reporting cycle.
3D stereoscopic sensors with AI video analytics deliver the accuracy needed to make conversion-rate decisions you can defend in a board meeting — not directional guesswork.
Align rotas to true peak hours, not anecdotes.
Attribute footfall lift to specific campaigns.
A/B test floor plans against engagement data.
Rank stores like-for-like across the estate.
Book a 20-minute review with the Smart Urban Sensing team. We’ll walk through your current reporting, identify the quickest commercial win and outline a single-entrance pilot or full multi-site rollout — whichever fits your estate.
Review the sector, site and reporting goals.
Assess entrances, counters and current visibility gaps.
Define the shortest trial path and likely ROI case.
Convert the pilot into a broader deployment programme.
Tell us about your stores, entrances and current reporting. We’ll come back with the shortest path to a retail pilot and a clear ROI case.
Review entrances, visibility gaps and the likely quickest win.
Low-friction proof-of-value before a wider deployment.
Frame likely performance questions and ROI opportunities.
Our people counting deployments are built around UK retail privacy expectations and follow the principles set out in the ICO’s UK GDPR guidance for in-store analytics, and align with retail performance benchmarks reported by the British Retail Consortium.