Henry Moore Institute
From manual clickers to exhibition-level visitor insight.
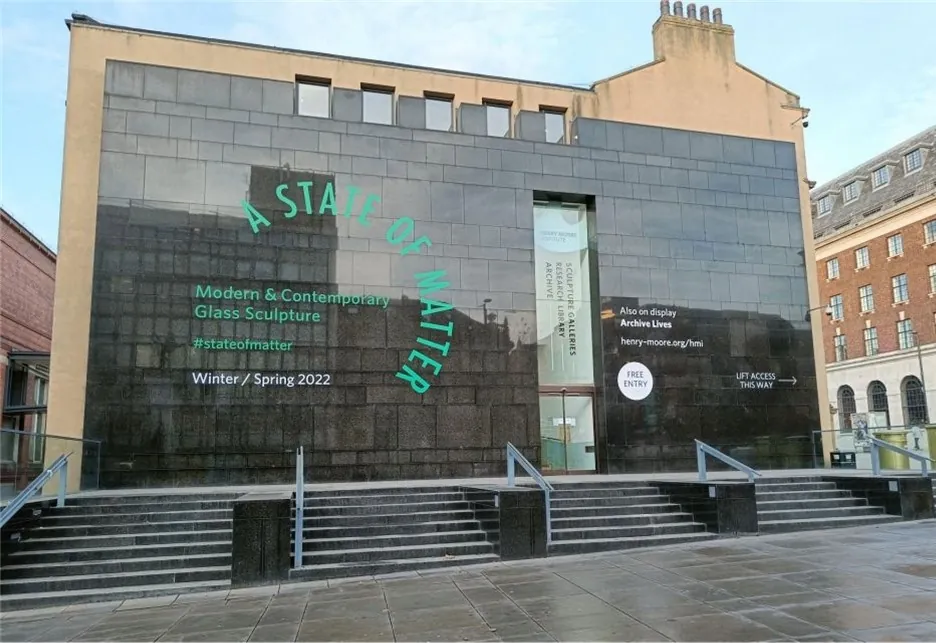
The Henry Moore Institute, Leeds — a sculpture gallery neighbouring Leeds Art Gallery, with systems installed throughout the site. Installation dates and the number of counted halls are not published.
Project at a glance
Customer
Culture & heritage · Funding-grade visitor evidence
Deployment scope
See the installation account below
Measurement focus
Scope or reporting capability, not a verified uplift
Delivery partner
Supplier-reported deployment and legacy baseline
The initial problem
Counting was done by hand. Staff used a manual clicker at each gallery hall, and the published account states the process was consistently producing incorrect data with error margins greater than 20% a day. At closing, footfall was passed from security staff into a monthly logbook and typed into the reporting system. The gallery had no accurate view of how individual halls were being used. That mattered beyond curiosity: the gallery is government funded, and funding is received according to how many visitors attend across the year. Ticket-based estimates compounded the problem — a coach party of children entering on one group ticket counts as one.
Read the published account ↗What SUS installed
SUS installed multiple AI 3D counting and tracking systems throughout the site, delivering visitor usage, footfall and people-flow data, including real-time footfall and occupancy counts for each area. No manual-count validation sample or accuracy test for this site is published.
Read the published account ↗How the reporting was used
SUS reports that real-time footfall and occupancy counts for individual areas inform the allocation of security guards and other staff to exhibition halls. The account also describes using visitor data to plan, market and arrange special events. These are supplier-reported operating practices; no named exhibition, dated staffing change or before-and-after rota is provided.
Read the published account ↗The operational change
The reported change is from manual counting and logbooks to building-wide visitor analytics and per-area staffing insight. The SUS account attributes lower costs and improved visitor experience to this approach, but supplies no cost calculation or measured visitor-experience result. These remain unquantified supplier claims, not newly validated outcomes.
Read the published account ↗What the evidence supports
The SUS account describes per-area staffing allocation but not a dated intervention. Its greater-than-20% figure concerns the former manual-counting error, not an improvement achieved by the new system.
Sources, approvals and measurement standard
Evidence detail
The published SUS account reports a greater-than-20% daily error margin for the former manual method. That is a legacy supplier-reported baseline, not a measured improvement from the installed system. No underlying sample, post-installation accuracy record or cost-saving calculation is published.
Standard for newly validated outcomes
A future result will be labelled “Measurement record available” only when its KPI definition, baseline, comparison period, site scope, counting exclusions, calculation and source records have been reviewed and publication approved. This is the acceptance standard, not a claim that every existing figure has passed it.
Legacy figures and qualitative accounts
Previously published supplier figures remain labelled as such, with missing measurement details stated. Installation facts, reporting capabilities and qualitative operational changes are not commercial uplift. None of the figures here is presented as independently verified.
Turn visitor evidence into better planning and reporting.
Tell SUS what you need to understand, where you need coverage and which decision better data should inform. Send it through the SUS enquiry form and mention this customer story.
Request an occupancy/site survey ↗View matching deployment →