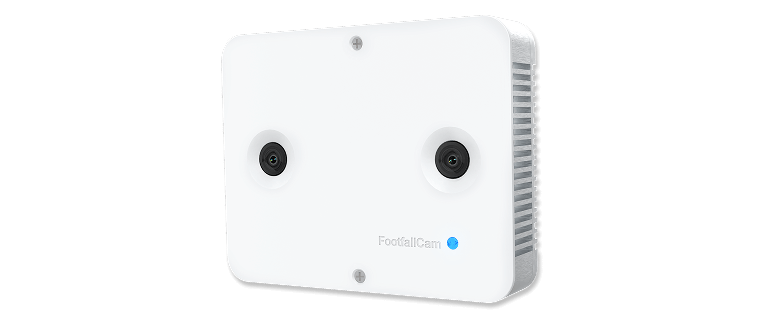
Our complete Q&A guide to AI people counting sensors covered the technology, accuracy, privacy, and integration detail. Our follow-up on 7 warning signs your legacy counter needs replacing tackled the upgrade decision.
Today’s post is different. These are the questions we get asked most often by buyers mid-decision — the practical, commercial, “will this actually work for me?” questions that don’t always make it into a technical spec sheet.
If you’re evaluating people counting for a retail estate, shopping centre, council project, or smart building — these are the answers you need before you commit.
1. How much does a people counting system actually cost?
This is the single most-searched question in the market — and the one most vendors dodge.
Here’s the honest answer: a single AI 3D people counting sensor from Smart Urban Sensing starts at £895 for the hardware, purchased outright. You own it.
For comparison, legacy vendors typically charge £1,200–£2,500 per store per year on a bundled hardware-plus-software contract. Over a five-year term, that’s £6,000–£12,500 — for a system that often delivers less functionality than a modern sensor at a fraction of the price.
Optional analytics tiers (heatmaps, journey tracking, demographic profiling) are available as add-ons. Use our Pricing Calculator to build a quote for your specific deployment.
The key question isn’t “what does a sensor cost?” — it’s “what does inaccurate data cost you every month you don’t have one?”
2. What’s the ROI, and how fast does a people counter pay for itself?
A people counter doesn’t generate revenue directly. It generates the data that makes every other revenue decision more accurate. The ROI comes from four places:
Conversion rate visibility — Knowing your true visitor-to-transaction ratio means you stop guessing why sales are down and start diagnosing whether the problem is traffic (marketing) or in-store execution (staff, stock, layout).
Labour optimisation — Aligning staffing schedules to actual peak footfall windows instead of assumptions. Retailers typically find 10–20% labour cost savings in the first quarter.
Marketing attribution — Measuring whether a campaign actually drove physical footfall, not just clicks.
Eliminated legacy fees — If you’re replacing an existing system with annual licence costs, the new hardware often pays for itself in under 12 months from fee savings alone.
For a typical 5-store retail deployment, our ROI Calculator models payback periods of 3–6 months. For council and BID-funded projects, the payback is measured in evidence quality — accurate footfall data directly supports funding applications, grant renewals, and high street regeneration cases.
3. How many sensors do I need for my entrance?
This depends on two variables: entrance width and mounting height.
A single AI 3D sensor covers approximately 2.5–3.0 metres of walkable width when mounted at the standard height of 2.7–3.5m. Here’s the quick rule:
| Entrance Width | Sensors Required |
|---|---|
| Up to 3m | 1 sensor |
| 3m – 6m | 2 sensors (tiled) |
| 6m – 9m | 3 sensors (tiled) |
| 9m+ (e.g. shopping centre atrium) | Custom tiled array |
Critical point: Measure the walkable width only — not the full doorframe. If your 4-metre entrance has a pillar in the centre creating two 1.8m passages, that’s two separate counting zones, each covered by a single sensor.
For double doors, revolving doors, or unusual entrance geometries, a free site survey will confirm the exact configuration. Book one here.
4. Can people counters work outdoors?
Yes — but the technology choice matters enormously.
Indoor-optimised 3D stereo and ToF sensors are designed for controlled environments with stable lighting and ceiling mounting. Outdoors, you face direct sunlight interference, rain, temperature extremes, no overhead mounting structure, and vastly wider counting areas.
For outdoor deployments — high streets, parks, public spaces, transport hubs — the recommended approach is:
- AI Edge cameras with IR capability mounted on poles, lamp posts, or building facades at 3–5m height
- IP67-rated enclosures for weather protection
- Cellular IoT connectivity (4G/5G gateway) for sites without fixed broadband
- Solar or mains power depending on site infrastructure
Smart Urban Sensing’s AI 3D IoT Outdoor sensor is purpose-built for these environments, with an IP67 housing and onboard 4G connectivity.
Outdoor accuracy typically sits at 95–97% due to wider fields of view and environmental variables — lower than indoor sensors, but vastly superior to the now-obsolete WiFi probe method (which collapsed below 50% accuracy after MAC address randomisation).
5. Do I need WiFi or internet connectivity for the sensors to work?
No. This is one of the most common misconceptions.
AI people counters process everything on-device (edge AI). The sensor counts, tracks direction, calculates occupancy, and stores data locally — all without any internet connection. Connectivity is only required to transmit the data to your dashboard or analytics platform.
For connectivity, you have three options:
- Wired Ethernet (PoE) — Most reliable. A single Cat5e/Cat6 cable carries both data and power.
- WiFi — The sensor connects to your existing wireless network. Suitable for sites where running cable is impractical.
- Cellular IoT (4G gateway) — For remote or outdoor sites with no fixed network. A small cellular router (such as the UR35) provides a dedicated data connection.
If internet connectivity drops temporarily, the sensor continues counting and stores data locally. When connectivity resumes, it backfills the missing data automatically. You don’t lose a single count.
6. How do I compare footfall performance across multiple stores?
This is where people counting becomes genuinely strategic rather than operational.
Multi-store benchmarking requires three things:
Standardised hardware — Every store uses the same sensor technology, mounted and calibrated consistently. Mixed hardware (some stores on legacy IR beams, others on AI 3D) produces incomparable data.
Centralised analytics platform — All stores reporting into a single dashboard with normalised time zones, opening hours, and calendar events. The Smart Urban Sensing analytics platform supports unlimited locations on a single account.
Consistent KPI definitions — Conversion rate must be calculated identically across all sites (same staff exclusion method, same entry-only counting logic, same POS data alignment).
Once those foundations are in place, you can benchmark:
- Footfall per store — Which locations attract the most visitors?
- Conversion rate per store — Which stores convert best (and worst)?
- Sales per visitor (SPV) — The truest measure of store productivity
- Traffic-to-labour ratio — Are you over-staffed in quiet stores and under-staffed in busy ones?
- Campaign lift by location — Did the same promotion drive different footfall results in different regions?
Retailers operating 10+ stores typically identify 15–25% performance variance between their best and worst locations — variance that was invisible without standardised footfall data.
7. What reports and dashboards do I actually get?
The standard Smart Urban Sensing analytics platform provides:
- Real-time live count — Current occupancy and today’s running total, accessible on any device
- Hourly, daily, weekly, monthly footfall trends — With year-on-year comparison
- Entry vs. exit breakdown — Bidirectional data with net occupancy calculation
- Peak hour analysis — Identifies your busiest trading windows automatically
- Heatmaps (optional tier) — Visual representation of where visitors spend time within your space
- Conversion rate dashboard — When integrated with POS data, automatic calculation of visitor-to-transaction ratio
- Automated email reports — Scheduled daily, weekly, or monthly summaries delivered to your inbox
- Threshold alerts — SMS or email notifications when occupancy exceeds defined limits (critical for fire safety compliance)
- API access — Full REST API and MQTT feeds for integration with Power BI, Google Sheets, your BMS, or any third-party platform
All data is exportable to CSV. There are no data lock-in mechanisms and no proprietary formats.
8. Can people counters count children separately from adults?
Yes — and this is increasingly requested by family-focused retailers, museums, libraries, and leisure venues where child admission pricing differs from adult pricing.
3D depth sensors measure the height of each tracked individual as part of the detection process. By setting a height threshold (typically 1.2m), the system classifies each person as either an adult or a child and logs them in separate count categories.
Accuracy of height-based classification is approximately 90–95% — it works well for young children but becomes less reliable for older children and shorter adults near the threshold boundary. For most commercial applications, this level of accuracy is more than sufficient for capacity planning and pricing analysis.
9. Can the system detect queues and measure wait times?
Yes. Queue detection is an extension of the same AI tracking pipeline used for counting.
The sensor defines a queue zone within its field of view. When tracked individuals remain within that zone for longer than a defined dwell-time threshold (e.g., 30 seconds), the system classifies them as “queuing” rather than “passing through.” The analytics platform then reports:
- Current queue length (number of people)
- Average wait time per person
- Maximum wait time within any given period
- Queue abandonment rate — the percentage of people who joined the queue zone but left before reaching the front
This data is critical for retail checkout optimisation, airport security lanes, council service desks, and any environment where customer wait time directly affects satisfaction and revenue.
10. What’s the difference between “footfall” and “occupancy” — and which do I need?
Footfall (also called traffic count) is the total number of entries over a period of time. It answers: “How many visitors came today?” This is the denominator for conversion rate and the primary metric for marketing attribution.
Occupancy is the number of people currently inside the space at any given moment. It’s calculated as a running net total: entries minus exits. It answers: “How many people are in the building right now?” This is the critical metric for fire safety compliance, HVAC optimisation, and real-time capacity management.
Most modern AI sensors deliver both metrics simultaneously from the same hardware — bidirectional counting inherently produces both a footfall total and a live occupancy figure.
If your primary use case is retail analytics and marketing, footfall is your lead metric. If your use case is building safety, energy management, or regulatory compliance, occupancy is what matters. In practice, most deployments use both.
11. How long does installation take, and will it disrupt my business?
For a standard single-entrance retail store: under two hours from arrival to live data.
The sensor mounts to the ceiling above the entrance via a standard bracket. A single PoE cable runs to your network switch or router. The installer configures the counting line, sets up staff exclusion if required, performs a validation count, and connects the sensor to your analytics dashboard.
There is no drilling into walls, no disruption to the shop floor, and no need to close the store. Installation is typically scheduled outside peak trading hours as a courtesy, but it does not require the premises to be empty.
For multi-store rollouts (10+ sites), Smart Urban Sensing provides a dedicated project manager to coordinate scheduling and ensure consistent installation standards across every location.
12. What happens to my data if the vendor goes out of business?
This is one of the most important — and least asked — questions in the buying process.
With a subscription-dependent system where you don’t own the hardware and your data lives on the vendor’s cloud platform, the answer is: you lose everything. If the vendor is acquired, pivots, or shuts down, your historical data may become inaccessible.
The Smart Urban Sensing model protects against this:
- You own the hardware outright — it doesn’t stop working if a contract expires
- Edge processing — the sensor counts independently of any cloud service
- Data export — full CSV and API export means your data is never locked in
- Open protocols — MQTT and REST API mean your data flows to platforms you control (Power BI, Google Sheets, your own database)
Your people counter should be an asset you own, not a service you rent. That distinction matters when you’re committing to a five-year data strategy.
13. Do people counters work with automatic/revolving doors?
Yes, but the installation approach varies by door type:
Sliding automatic doors — Standard overhead mounting, sensor positioned just inside the door threshold. The sensor counts once the individual has fully entered, not when the door activates. No accuracy impact.
Revolving doors — The sensor is mounted on the ceiling inside the vestibule, positioned after the revolving door exit point. Each individual is counted as they step out of the revolving segment into the main space.
Double swing doors (left and right) — A single sensor positioned centrally covers both door leaves provided the combined walkable width is within the sensor’s field of view (up to 3m). For wider double-door configurations, two sensors in a tiled arrangement are required.
The key principle: position the sensor where people walk, not where doors move. Door mechanisms create no interference with 3D depth sensors — they detect human bodies, not door panels.
14. Can I integrate people counting data with my EPOS/POS system?
Yes — and this is where footfall data becomes directly commercial.
The integration works by aligning two data streams on matching time intervals:
- Footfall data (from the people counter) — hourly visitor entries
- Transaction data (from your POS/EPOS) — hourly transaction count and revenue
When these two datasets are combined — either within the Smart Urban Sensing platform, via API into Power BI, or through a direct integration with your POS provider — you unlock:
- Conversion rate by hour, day, week, season
- Sales per visitor (SPV) — revenue divided by visitors, the most honest store productivity metric available
- Traffic-to-labour ratio — visitors per staff hour, enabling precision scheduling
- Promotional effectiveness — did the campaign drive footfall, conversion, or both?
Smart Urban Sensing supports POS integration via REST API, MQTT, and direct CSV import. If you’re running a major EPOS platform (Shopify POS, Square, Lightspeed, Vend, or similar), the data alignment is straightforward.
15. We already tried people counting years ago and it didn’t work. What’s changed?
This is possibly the most important question on this list, because it’s the one that stops businesses from ever re-evaluating.
If your previous experience was with infrared beam counters, the technology was fundamentally incapable of delivering accurate data. Beams can’t separate groups, can’t determine direction, can’t exclude staff, and degrade to 60–85% accuracy in real-world conditions. Every decision built on that data was compromised.
If your previous experience was with WiFi probe counting, the technology has been rendered obsolete by MAC address randomisation in iOS 14 and Android 10. Accuracy collapsed below 50%, and multiple European deployments were shut down on GDPR grounds.
If your previous experience was with early 2D camera systems, the AI models of 2018–2020 were a generation behind current capabilities. Modern 3D depth sensors with on-device AI achieve 99% accuracy, process data at the edge (no cloud dependency, no video storage, no GDPR risk), and cost a fraction of what earlier systems charged.
The technology has changed fundamentally. If you haven’t evaluated people counting in the last two years, you haven’t evaluated modern people counting at all.
Retail and shopping centres
Find out what your entrance data should be telling you
In 20 minutes we review your entrances, current counting setup and conversion questions, then tell you what accurate footfall data would change. No obligation, no hard sell.