
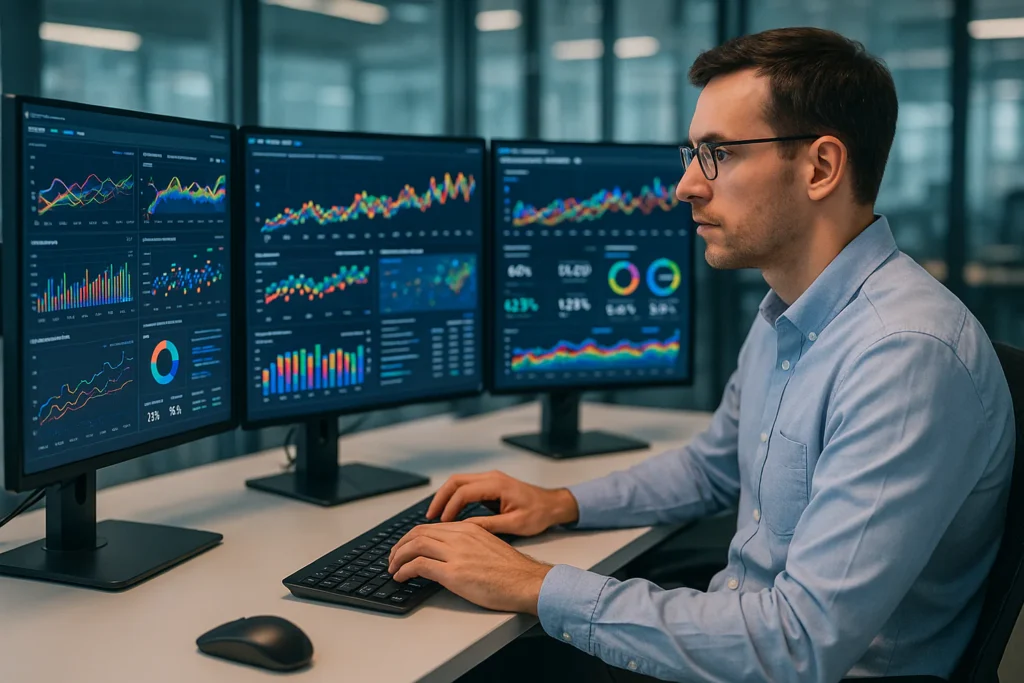
Real-time data is information delivered and processed within milliseconds or seconds of being generated, enabling immediate insight and action. From mobile banking apps that flag suspicious transactions before a customer notices, to occupancy sensors that shuffle staff to the busiest checkout, the ability to react right now has shifted from luxury to baseline expectation. Accelerated by connected devices, streaming platforms, and shorter consumer attention spans, businesses that still rely on hourly or nightly reports risk flying blind while competitors steer by live telemetry. Real-Time Data Explained: Benefits, Uses & Best Practices -store traffic counter – footfall counter – people counter occupancy https://smarturbansensing.co.uk/about-us/

This guide strips away jargon and marketing hype to show how real-time data works and why it matters. You’ll learn the formal definitions, latency windows and system components that qualify as ‘real-time’; the benefits for revenue, efficiency and customer experience; and the architectures, tools and practices that make low-latency analytics reliable at scale. We’ll tackle common pitfalls, from data quality to cost control, before exploring emerging trends such as edge AI and privacy-preserving computation. Whether you manage operations or engineer the pipelines, the next sections equip you with practical steps to turn streaming events into a competitive advantage.
What Counts as Real-Time? Definition, Scope and Key Terms
Real-time footfall counter retail device price UK counter
Not every fast-arriving event qualifies as real-time data. Before wiring up streaming pipelines, teams need a shared vocabulary for latency targets, processing style and system building blocks. The next subsections pin down the tolerances that separate “instant enough” from “too late”, compare alternative delivery modes, and outline the minimum ingredients of any credible real-time stack. https://smarturbansensing.co.uk/sectors/retail/
Formal definition & acceptable latency windows
Most reference sources describe real-time data as information that is captured, processed and made actionable “immediately”. In practice, “immediate” is bounded by the use-case:
- High-frequency trading:
t < 1 s - In-store footfall dashboards:
1 s ≤ t ≤ 5 s - Social media trend counters:
5 s ≤ t ≤ 30 s
Anything beyond half a minute usually slips into “near-real-time”. What matters is that the latency is shorter than the decision window. If a store manager needs 20 seconds to dispatch an extra cashier, a five-second occupancy delay is perfectly real-time.
Real-time vs live-time vs near-real-time vs batch
| Mode | Typical Latency | Processing | Storage Dependency | Example Scenario |
|---|---|---|---|---|
| Live-time | sub-millisecond | inline | none | Stock tick feed |
| Real-time | 1–30 s | streaming | hot store optional | Website clickstream |
| Near-real-time | 30 s–5 min | micro-batch | warm store | Fraud scoring refresh |
| Batch | hours–days | offline | data warehouse | Nightly sales report |
Live-time prioritises microscopic speed at high cost; batch favours throughput over immediacy. Real-time strikes the balance most business ops require.

Core components in any real-time data system
Regardless of tooling, four layers recur:
- Source layer—devices, apps or CDC taps emit timestamped events with immutable, idempotent IDs.
- Transport layer—brokers such as Kafka or MQTT move events with ordering and retry guarantees.
- Processing layer—stream engines filter, aggregate and enrich in motion.
- Serving layer—hot caches, APIs or dashboards surface insights for humans or automation.
Miss any layer and “real-time” collapses into hurried batch jobs masquerading as speed.
How Real-Time Data Flows From Capture to Insight Real-time footfall counter, retail device price, UK counter
A streaming pipeline resembles an assembly line: events roll off the source, shoot through high-speed conduits, get shaped and enriched on the fly, then land in stores and dashboards ready for decisions or automation. The five stages below show how milliseconds are shaved at every hop without sacrificing accuracy or fault-tolerance.
Data capture layer
Speed starts where the event originates.
- Device firmware on a 3D people counter emits an entry or exit record the moment the stereo-depth sensor registers body heat and movement.
- Mobile SDKs embed lightweight beacons in app clicks, while databases expose change-data-capture (CDC) logs that stream row updates.
Each record carries an immutable event ID and ISO-8601 timestamp so downstream systems can reconcile out-of-order arrivals.
Ingestion & transport mechanisms
Brokers move torrents of events safely:
- Apache Kafka partitions streams for horizontal scaling and offers at-least-once or exactly-once guarantees.
- MQTT suits constrained IoT devices; WebSockets power browser push.
Buffering smooths burst traffic, and back-pressure signals slow consumers to prevent overload. A simple latency budget formula is total_latency = network + broker_queue + processing.
Stream processing & analytics
Engines such as Flink or Spark Streaming perform:
- Filtering (drop sensor pings outside opening hours)
- Windowed aggregations (
COUNTentries per 30-second tumbling window) - Joins (merge footfall with POS sales to output live conversion rate)
- Complex event processing to spot patterns, e.g. repeated badge swipes indicating tailgating.
State checkpoints and exactly-once sinks guard against duplicates during failover.
Storage & serving layers
Hot stores keep the freshest slices in RAM or SSD—Redis, Apache Druid, ClickHouse—while warm object storage retains hours or days for replays. Older data rolls into cost-effective cold archives (S3, Azure Blob). Teams often mix both in a Lambda (batch + stream) or Kappa (stream-only) design depending on historical query needs.
Visualisation, alerting & automated action
Grafana or custom web UIs render live tiles; p95 latency gauges reveal pipeline health. Alerting rules push Slack or SMS when occupancy > threshold, and REST hooks can trigger staff-roster microservices to redeploy colleagues to busy aisles—closing the loop from sensor to action in under five seconds.
Tangible Business Benefits of Real-Time Data
Latency may be a technical metric, but its pay-off is felt on the balance sheet. When insights surface while a decision can still be made, organisations unlock four clusters of value that batch reporting simply cannot match.
Faster decision-making and competitive agility
Live dashboards turn a stream of raw events into an early-warning system. Retail directors can see stockouts forming and re-route inventory before a rival scoops the sale; traders adjust positions mid-volatility instead of nursing losses at day-end. The ability to respond inside the same time window as the event itself shifts strategy from reactive to proactive.
Operational efficiency & cost reduction
Continuous telemetry exposes waste in real time. Manufacturers detect vibration anomalies and schedule maintenance during the next micro-shutdown, avoiding catastrophic downtime. Facilities teams watching live occupancy can dim lighting or HVAC in unused zones, shaving energy spend without compromising comfort. Every optimisation compounds into material OPEX savings.
Enhanced customer experience & personalisation
Nobody enjoys queues or irrelevant offers. Streaming people-count data feeds queue-length algorithms that call extra staff to tills before frustration builds. At the same time, clickstream events trigger personalised recommendations while the customer is still browsing, creating a smooth, hyper-relevant journey that encourages loyalty.
Revenue growth & measurable ROI
When marketing, operations and pricing decisions draw on current data, revenue lifts become traceable. Real-time attribution ties footfall spikes to specific campaigns, proving ROI within hours. Dynamic pricing engines balance demand and margin minute by minute, adding incremental profit that static price lists leave on the table.
High-Impact Use Cases Across Industries Real-time footfall counter retail device price UK counter
From edge devices to capital markets, the same technical pattern produces very different business wins. The snapshots below highlight where streaming insights deliver outsized impact right now.
Retail & in-store analytics
Smart cameras and [3D people counters](https://www.smarturbansensing.com/blogs/from-counting-heads-to-orchestrating-people-flow-smart-urban-sensing/ai-3dpro-and-ai-3dpro2-2025-comparison) translate footfall into live staffing, merchandising and safety decisions. Real-time heatmaps reveal bottlenecks; queue alerts cut wait times; linking entry counts with EPOS data surfaces conversion in minutes, not days.
Financial services & trading
Millisecond access to tick data underpins automated market making, live risk management and continuous compliance checks. Streaming anomaly detection flags fraudulent card usage before authorisation completes, protecting both bank and customer.
Manufacturing & supply chain
Industrial IoT sensors stream vibration, temperature and throughput metrics. Predictive algorithms schedule maintenance just before failure, while fleet telematics reroute lorries around congestion, trimming fuel and late-delivery penalties.
Smart cities & transport
Traffic lights subscribe to vehicle and pedestrian telemetry, adjusting phases dynamically to reduce idle time and emissions. Transit authorities publish bus GPS feeds so journey planners can calculate accurate ETAs and push delay alerts to commuters.
Healthcare & emergency response
Wearables and bedside monitors broadcast vitals every second. Dashboards highlight early signs of sepsis, and dispatch systems redirect ambulances based on live hospital capacity, shaving critical minutes off response times.
Digital marketing & ad-tech
Bid platforms crunch impression streams to place personalised ads within 100 ms. Marketers stitch click, store visit and purchase events into a live journey map, enabling campaign tweaks while budget is still in play.
Technical Stack & Architectural Patterns for Real-Time Analytics
Behind every “live” dashboard sits a stack purpose-built to move events quickly, safely and at scale. While product names differ, successful solutions share common architectural principles, which we break down below.
Event-driven architecture fundamentals
In an event-driven model:
- Producers emit immutable events, ideally with idempotent IDs and ISO timestamps.
- A broker (Kafka, Pulsar, MQTT) decouples producers from consumers, enabling horizontal scaling and back-pressure.
- Consumers subscribe to topics, process events independently and persist derived state.
This loose coupling means one bad service can’t freeze the whole pipeline—a must for sub-second real-time data flows.
Choosing between Lambda, Kappa and streaming-first designs
- Lambda: dual path—stream for fresh data, batch for historical replays. Offers flexibility but doubles code.
- Kappa: single streaming path; historical queries achieved by replaying the log. Simpler maintenance, but long replays can be costly.
- Streaming-first microservices: each team owns its own topic → processor → API. Works well in data-mesh organisations where domains publish and consume events autonomously.
Pick the pattern that aligns with latency budgets and team skills, not fashion.
Key technologies & open-source tools
| Layer | Popular Options | Typical Role |
|---|---|---|
| Transport | Apache Kafka, AWS Kinesis | Ordered, durable event log |
| Processing | Apache Flink, Spark Structured Streaming | Stateful aggregations, joins |
| Serving | Druid, ClickHouse, Redis | Low-latency queries & OLAP |
| Observability | Prometheus, Grafana, OpenTelemetry | Lag, throughput, error tracking |
Open-source keeps licence costs low while avoiding vendor lock-in.
Edge, cloud and hybrid processing
- Edge: Runs logic on sensors or gateways for ultra-low latency and bandwidth savings (e.g., people counter filters noise before uplink).
- Cloud: Elastic compute and managed services accelerate delivery.
- Hybrid: Pre-process at edge, enrich in cloud—ideal when GDPR or 5G constraints apply.
Security, compliance and privacy
Real-time does not excuse poor governance:
- Encrypt in transit (
TLS 1.2+) and at rest (KMS-managed keys). - Apply role-based ACLs on topics and metrics.
- Mask or hash PII at the edge to stay GDPR-compliant, mirroring Smart Urban Sensing’s privacy-first approach.
- Audit pipelines with immutable logs to prove data integrity.
Following these guardrails ensures streaming insights arrive fast—without becoming a liability.
Common Challenges and How to Mitigate Them
Even the slickest streaming stack can trip over practical hurdles once live traffic ramps up. Recognising the usual suspects—and designing for them upfront—prevents late-night fire-fighting later on.
Data volume & velocity management
- Partition topics by natural keys; shard hot stores.
- Auto-scale consumers via Kubernetes HPA or serverless.
- Apply tiered retention: minutes in RAM, weeks on SSD, months in object storage.
Guaranteeing low latency and high data quality
- Enforce schemas with a registry; reject unknown fields.
- Pre-compute p95 lag dashboards and alert on threshold breaches.
- Insert debouncing filters at edge devices to drop noise before transit.
Exactly-once semantics & consistency
- Use Kafka idempotent producers and transactional sinks.
- Checkpoint stream processors to durable storage every few seconds.
- Design sinks with upsert keys so replays do not create duplicates.
Cost control & resource optimisation
- Right-size partitions; idle partitions equal wasted brokers.
- Employ tiered storage and autoscaling to avoid 24/7 over-provisioning.
- Continuously profile queries; push heavy analytics to warm layers.
Skills gap & organisational adoption
- Form cross-functional squads pairing data engineers with domain leads.
- Codify patterns in an internal playbook and reusable Terraform modules.
- Start with one high-value use case, prove ROI, then expand incrementally. https://smarturbansensing.co.uk/products/ai-3d-pro-2/

Best Practices for a Successful Real-Time Data Strategy
A shiny stream processor won’t pay for itself unless everyone knows why the stream exists. The five guidelines below summarise lessons from production deployments across retail, finance and IoT.
Start with clear business objectives and KPIs
Link each stream and dashboard to a specific decision—e.g., ‘keep queue time under two minutes’. Track leading metrics like occupancy change or imminent stock-outs that trigger action.
Design for scalability and future growth
Adopt modular microservices, schema versioning and infrastructure-as-code so topics and consumers can multiply without weekend migrations. Plan cardinality limits, partition keys and load tests early.
Prioritise governance, privacy and ethics
Register every event contract, mask personally identifiable fields at the edge, and enforce role-based ACLs. Document why data is collected and publish sunset schedules to satisfy GDPR.
Implement robust monitoring and observability
Expose end-to-end latency, throughput, error rate and consumer lag in one dashboard. Fire alerts when p95 latency breaches SLA or duplicate rate exceeds the agreed threshold.
Iterate, measure and improve continuously
Treat pipelines like products: release small, run A/B tests, hold post-mortems, and fold learnings back into code. Continuous improvement keeps the real-time ecosystem aligned with business goals.
Key Metrics and KPIs to Monitor Real-time footfall counter retail device price UK counter
Dashboards only earn their keep when they track the numbers that prove your real-time data strategy is working. Keep the list short, visible, and tied to a decision or SLA; everything else is noise.
Latency metrics
- Event-time vs processing-time lag (
lag = now() – event_timestamp) - p95/p99 end-to-end latency by stream
- Broker queue depth and consumer lag
Data reliability & freshness
- Duplicate rate (events with identical IDs ÷ total events)
- Data-loss percentage detected via checkpoint counts
- Completeness score: expected vs received events per window
Business outcome indicators
- Conversion uplift: live conversion ÷ historical baseline
- Average dwell time and change after interventions
- Churn-rate delta following real-time personalisation
Cost and efficiency metrics
- Cost per million events processed
- Compute utilisation (CPU/GB hours ÷ provisioned capacity)
- Storage cost ratio: hot : warm : cold tiers
Looking Ahead: Emerging Trends in Real-Time Data
Real-time data tooling is evolving beyond dashboards towards autonomous, privacy-aware decision-loops. The four trends below are already appearing on 2026 technology roadmaps and merit a place in long-term planning.
AI and machine learning on streaming data
Model training is moving from nightly batches to continuous online learning. Stream processors now feed incremental updates into classifiers, reinforcement agents and real-time anomaly detectors that adapt to concept drift in minutes, not months.
Edge analytics powered by 5G and IoT
Ultra-low-latency 5G links let sensors run analytics locally—powering AR fitting rooms, autonomous forklifts and smart lighting without round-trips to the cloud. Bandwidth and energy savings are welcome side-effects.
Data mesh and decentralised ownership models
Enterprises are publishing domain-specific “event products” with clear contracts, enabling teams to build self-serve pipelines without central bottlenecks. Governance shifts from monolith platforms to federated, schema-first practices.
Privacy-enhancing computation
Techniques such as differential privacy, federated analytics and confidential computing allow insight generation while keeping raw data hidden. Expect regulators to favour solutions that prove privacy mathematically—especially for biometric and location streams.
Final Thoughts Real-time footfall counter retail device price UK counter
Real-time data is no longer a buzz phrase; it is a workable discipline that joins milliseconds of raw events to measurable business outcomes. We have defined what counts as “real-time”, walked through capture-to-insight pipelines, and shown how low-latency streams unlock faster decisions, leaner operations, happier customers and verifiable ROI.
You now know where in retail, finance, manufacturing or city infrastructure streaming analytics has the biggest impact, which architectural patterns and tools deliver the goods, and how to sidestep common pitfalls with governance, cost and talent. The metrics checklist and emerging-trend watch-list round off a practical playbook you can start using today.
The next move is yours. If you operate physical venues and want immediate visibility of footfall, dwell and queue health, consider trialling Smart Urban Sensing’s live people-counting platform. A single sensor can turn real-world movement into actionable dashboards in under a minute, letting you prove value before scaling. Visit Smart Urban Sensing and start closing the gap between data and action.
Real-time starts now—make your data speak instantly.
Researching footfall analytics?
Get the supplier-neutral footfall & occupancy buyer checklist
Entrance survey sheet, 24 buyer checks, a simple ROI worksheet and the red flags to watch for. We will email it to you — and, if you like, a short monthly retail analytics briefing.


