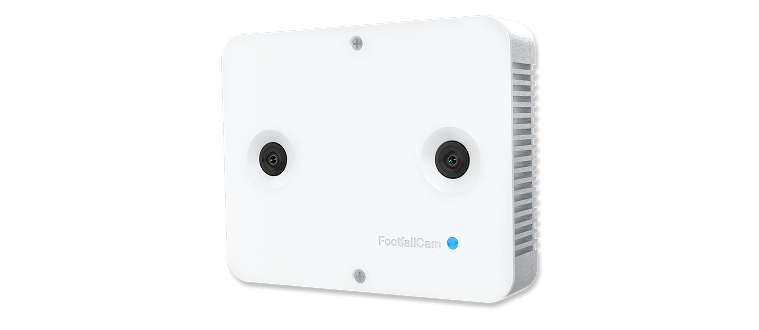
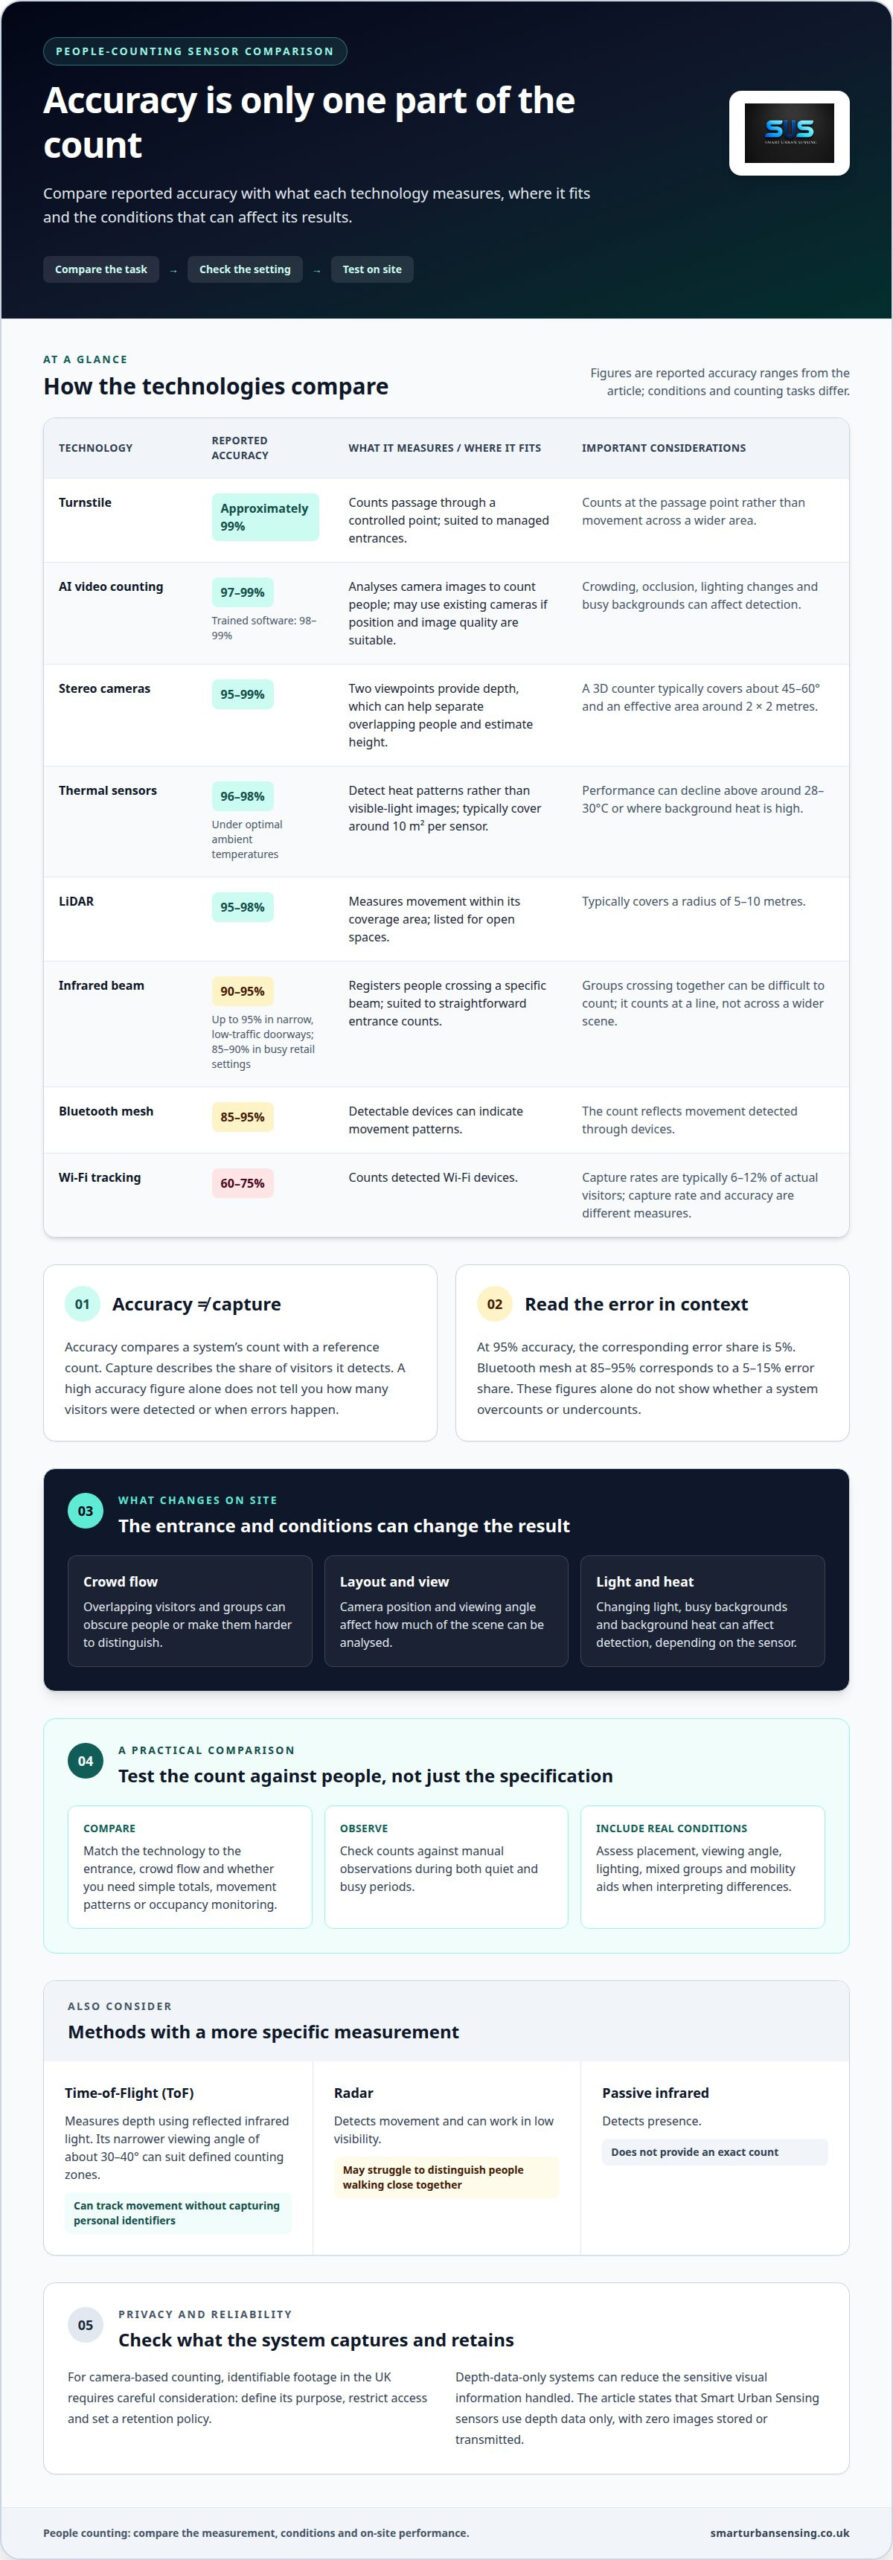
The most accurate sensor on paper may not be the best fit for your site. A people counting sensor accuracy comparison shows infrared beam counters at 90-95% accuracy, stereo cameras at 95-99%, and AI video people-counting at 97-99%, but crowding, layout and lighting can affect real-world results.
It’s reasonable to focus on the headline percentage when comparing systems. But accuracy is only part of the picture: the sensor must also suit the space, the flow of people and the decisions its data will support.
This guide compares common counting technologies for buildings, retail and transport, explains how to test counts against manual observations, and outlines what to assess during busy periods. You’ll get a practical way to judge which approach fits your needs, rather than relying on a specification alone.
Key Takeaways
- Compare sensors by how they handle your entrance, layout and crowd flow, not by headline accuracy alone.
- Match the technology to the task: simple entrance counts, detailed movement data and occupancy monitoring have different needs.
- Test performance against manual counts during both quiet and busy periods to see how the system behaves on site.
- Assess camera placement, viewing angle and conditions such as lighting or background heat when interpreting count differences.
- Choose an approach suited to the setting, whether you’re measuring footfall in a building or tracking passenger flows in transport.
How do people counting systems compare?
Accuracy depends on the sensing method and conditions at the entrance. Compare how each system handles overlapping visitors, changing light and the area being monitored.
Beam and camera methods
Infrared beam counters register people crossing a beam, making them suited to straightforward entrance counts. They can struggle when groups cross together, although narrow, low-traffic doorways can reach 95% accuracy; busy retail settings may see 85-90%. Camera systems analyse images instead, helping distinguish individuals, but crowding and occlusion can obscure people. AI video counting is listed at 97-99% accuracy, with specifically trained software at 98-99%.
Thermal and Time-of-Flight methods
Thermal sensors detect heat patterns rather than relying on visible-light images. They typically cover around 10 square metres per sensor, with accuracy of 96-98% under optimal ambient temperatures; performance can decline above around 28-30°C or where background heat is high. Time-of-Flight (ToF) sensors measure depth using reflected infrared light. They can track movement without capturing personal identifiers, and their narrower viewing angle, about 30-40°, can suit defined counting zones.
Radar and infrared methods
Radar detects movement and can work in low visibility, but may struggle to distinguish people walking close together. Infrared beam sensors register crossings at a specific line rather than counting people across a wider scene. Passive infrared detects presence but doesn’t provide an exact count. Choose according to whether you need to detect activity or count entries and exits.
Camera performance across conditions
Camera angle shapes how much of a scene the system can analyse. A 2D counter uses one camera and may have a viewing angle up to about 90°; a 3D counter uses two cameras and typically covers about 45-60°, with an effective area around 2×2 metres. Wider views can capture more space, while depth information can help separate overlapping people. RGB cameras can distinguish individuals, but lighting changes, busy backgrounds and occlusion can affect detection.
For camera-based counting, privacy depends on what the system captures and retains. In the UK, identifiable footage requires careful consideration: define its purpose, restrict access and set a retention policy. Privacy-first, GDPR-compliant systems that use depth data only can reduce the sensitive visual information handled. Smart Urban Sensing’s sensors use depth data only: zero images stored or transmitted.
Children, groups and wheelchair users can be missed or misclassified when people overlap or appear at different heights. Objects may also be mistaken for people if they resemble a person in the sensor’s view. Test these real-world conditions, including mixed groups and mobility aids, rather than relying on a headline accuracy figure.
AI video analytics can use existing cameras if their position and image quality support reliable counting. Choose a system based on the entrance layout, expected crowd flow, lighting and whether you need simple totals or more detailed analytics.
People-counting sensor technologies
Sensor choice affects what a system measures, how much space it covers and which visitors it detects. A people counting sensor accuracy comparison is most useful when it considers the intended task, not accuracy figures alone.
Monocular and binocular technologies
A monocular vision counter uses one camera to interpret a scene; binocular, or stereo, vision uses two viewpoints to provide depth. That extra dimension can help separate people who overlap and estimate height. Some 3D stereo-vision counters can distinguish adults from children. This can support more detailed visitor analysis, while a single-camera system may suit applications where broad totals matter more than depth information.
Accuracy across sensor technologies
Reported figures vary: turnstiles are listed at approximately 99% accuracy, LiDAR at 95-98%, Bluetooth mesh at 85-95%, and Wi-Fi tracking at 60-75%. Wi-Fi capture rates are typically 6-12% of actual visitors, so detection coverage and accuracy are different measures. Accuracy compares a system’s count with a reference; capture describes the share of visitors it detects. Keep both in view when comparing technology.
Coverage and use-case choices
Match sensor coverage to the space and the decision the count will inform. LiDAR typically covers a radius of 5-10 metres, while thermal sensors typically cover around 10 square metres per sensor. Bluetooth mesh can indicate movement patterns through detectable devices; a turnstile counts people passing a controlled point. For transport operators measuring passenger flows, a Bus Passenger counter is a purpose-specific option.
Accuracy rates and error margins
An accuracy figure also implies a difference from the reference count: at 95% accuracy, the corresponding error share is 5%. That percentage alone doesn’t reveal whether the system tends to overcount or undercount, or whether errors occur mainly during busy periods. For example, the listed 85-95% range for Bluetooth mesh corresponds to a 5-15% error share. Read a people counting sensor accuracy comparison alongside the test conditions.
The table summarises reported accuracy and measurement approaches. Choose a technology based on whether you need controlled passage counts, movement patterns or area coverage.
| Technology | Listed accuracy | What it measures | Typical application |
|---|---|---|---|
| Turnstile | Approximately 99% | Passage through a controlled point | Managed entrances |
| LiDAR | 95-98% | Movement within its coverage area | Open spaces |
| Bluetooth mesh | 85-95% | Movement detected through devices | Movement patterns |
| Wi-Fi tracking | 60-75% | Detected Wi-Fi devices | Indicative visitor trends |
To discuss passenger-counting requirements and sensor selection, contact the team about passenger counting or email sales@smarturbansensing.co.uk.
On-site accuracy testing against manual counts
A site trial shows whether a counting device reflects actual footfall in the conditions that matter. Compare its output with a manual count at the same entrance and time. Test both busy and quiet periods: a system may perform well during steady flow but miss people arriving together.
Manual counting is a useful reference, but it also has limitations. Manual counts are listed with accuracy of 70-90%, depending on the person counting. Fatigue, blocked sightlines and groups crossing together can cause missed or duplicated entries. A consistent counting rule helps: decide whether to count entries, exits or both, then apply it throughout each observation.
Use a defined trial plan so the sensor and the manual observer measure the same flow. A pilot comparing system counts with manual counts during peak hours should run for 1 to 2 weeks. Compare counts over matching busy and quiet periods. This reveals whether differences are isolated or recur under particular conditions.
- Set the counting boundary. Identify the entrance or zone, and decide whether the test measures entries, exits or total crossings.
- Synchronise the observations. Record manual and device counts over matching time intervals, including peak periods and quieter windows.
- Keep a consistent method. Use the same rules for groups, staff movements and people who turn back during the observation.
- Record the context. Note crowding, changes in flow and any obstruction that could affect the sensor or observer.
For calibration, run a manual count for 30 to 60 minutes and compare it with the sensor output. Calculate the difference using the same interval: subtract the manual total from the device total, then compare the size of that difference with the manual count. Keep overcounts and undercounts visible rather than cancelling them out across separate periods.
For each test window, report the manual total, device total, difference and observation period. For example, record a busy lunchtime separately from a quieter morning instead of combining both into one daily figure. This makes it easier to spot missed overlapping visitors or periods when the entrance was hard to observe manually.
Use the results to guide calibration and integration with footfall analytics or conversion reporting. Conversion calculations rely on comparable visitor and transaction periods, so inconsistent entrance counts can distort the trend. After adjustments, repeat the test at the same location, using the same counting rules and time windows, to see whether agreement improves.
Verifying counts and assessing peak-period performance
A published accuracy figure doesn’t show how a sensor handles your site’s busiest traffic. Assess the installed system under real operating conditions, including temperature, lighting and visitor flow.
Thermal sensors measure heat patterns, so ambient conditions matter. Typical accuracy is 96-98% under optimal temperatures, and performance can degrade above around 28-30°C or where background heat is high. In an indoor space with warm equipment, compare sensor output with observed counts and note temperature conditions. This helps distinguish environmental effects from installation or counting errors.
Performance in low light and darkness
Low-light performance depends on what the sensor detects. RGB cameras rely on visible images and can be affected by poor lighting, shadows or changing backgrounds. Thermal sensors detect heat patterns, while Time-of-Flight systems measure depth using reflected infrared light. Compare counts with the lights dimmed and restored, recording the same entrance and direction of travel each time.
Comparing performance across sites
Identical devices can produce different results at two locations because layouts and traffic patterns differ. Compare similar entrance types, counting directions and observation periods, and report each site separately. A wide indoor entrance where groups arrive together, for example, isn’t directly comparable with a narrow doorway and steady, single-person flow. Record the installation position, obstructions and local conditions alongside each count.
Peak-period count verification
Peak periods can expose missed detections that quiet intervals conceal. Compare sensor totals with simultaneous manual observations during queues and overlapping arrivals and departures. Record each time interval and direction, then calculate the difference between the device count and observed count. Include both overcounts and undercounts in the report: averaging them can hide recurring errors at a busy entrance.
Review the same measures across locations: count difference, traffic level, lighting, ambient temperature and sensor position. If one entrance diverges from the others, investigate its conditions before changing settings across the whole platform. A thermal device beside a heat source, for example, needs a different assessment from a camera facing a dim corridor.
Keep reporting focused on decisions. Show the period measured, sensor count, reference count and relevant site conditions. When reporting anonymous, aggregated footfall, use consistent intervals to compare indoor locations without treating different traffic patterns as equivalent. This makes site-level differences visible and gives teams a clearer basis for operational adjustments.
Sensor applications in buildings, retail and transport
The right sensor depends on the flow being measured. A shop entrance, office lobby and bus door present different counting conditions, so one method may not suit all three.
In buildings, entrance counters can show when people arrive and leave, while sensors in shared areas can help estimate occupancy. A ceiling-mounted camera can monitor a defined zone, but position matters: doors, signs or architectural features may obstruct its view. In a reception area, decide whether the count should include staff, visitors or both. That choice shapes what the software reports and how teams interpret daily traffic.
Retail teams can compare entrance counts with transaction data to understand conversion trends. Match visitor and sales periods rather than treating a full-day footfall total as a direct measure of performance. Stores with multiple entrances need a consistent method at each one; differences in camera placement, visitor flow or counting direction can otherwise make comparisons misleading.
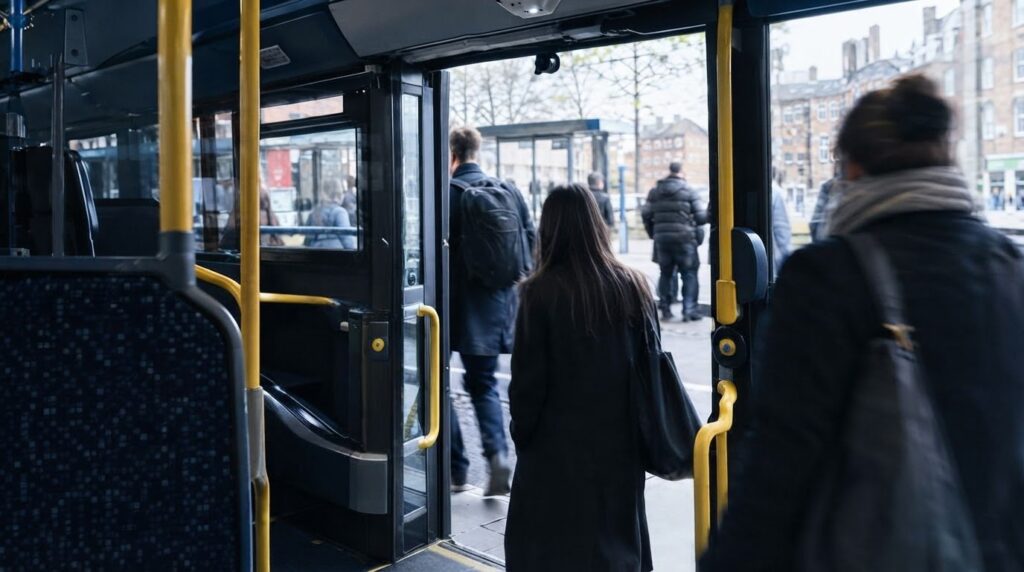
Transport presents a different use case. At a bus door, passenger counting measures boardings and alightings in a compact space where people may move close together. At a station entrance, flows may spread across wider access points. Choose a sensor to match the geometry and required output, such as passenger totals or broader movement patterns. A system designed for retail entry counts may not answer the same operational questions.
The sensing method affects what a system observes. Camera-based systems analyse a visual scene, thermal sensors detect heat patterns, and infrared beams register crossings at a set line. Choose according to the site’s lighting, background and flow. A bright shopfront and a dim corridor, for instance, create different conditions for image-based counting.
- Buildings: Define the monitored zone and whether occupancy includes staff or visitors.
- Retail: Match entrance counts with transaction periods to interpret conversion meaningfully.
- Transport: Separate boarding and alighting needs from general entrance footfall.
Before comparing multiple sites, standardise the counting direction, reporting period and entrance definition. A retail branch and a transport hub may both use people counts, but their flows and operational needs differ. Compare like with like, then use site-specific data to guide staffing, space planning or service adjustments.
To discuss a counting approach for a building, retail site or transport setting, contact the team about your sensor application or email sales@smarturbansensing.co.uk.
Smart Urban Sensing
Smart Urban Sensing helps businesses match people-counting technology to their site and measurement needs. If you’re assessing entrance accuracy, comparing sensor types or planning retail footfall measurement, its options include AI 3DPro1, AI 3DPro2 and Retail Starter Kits. The right choice depends on your layout, visitor flow and the data you need to use.
Share your environment and counting objectives with Smart Urban Sensing to discuss a suitable approach. A site survey helps assess the entrance layout, mounting position and conditions that published accuracy figures can’t capture.
Contact Smart Urban Sensing about people counting or email sales@smarturbansensing.co.uk.
Make your next counting decision with confidence
A people counting sensor accuracy comparison is most useful when it supports a clear operational decision. Before choosing a system, define who will use the data, what action it should inform and how you’ll assess its relevance as the site changes. A measurement plan based on those needs keeps reported data connected to day-to-day priorities.
Smart Urban Sensing can help you consider the right approach for your environment and objectives. To discuss your requirements, Book a free 20-minute footfall review or email sales@smarturbansensing.co.uk. A considered next step can bring greater clarity to your people-counting plans.
Frequently Asked Questions
Which people counting methods use a camera?
Vision-based counters use cameras to observe people moving through a defined area. This includes 2D cameras, stereo systems with two viewpoints, and AI video analytics that interpret camera images. Time-of-Flight equipment also uses camera-style sensing, but measures depth from reflected infrared light rather than ordinary colour images. The distinction affects what the device can measure, how lighting may influence counts and what privacy considerations apply at the site.
Accuracy: does 99% always mean the same thing?
No. A 99% figure is meaningful only alongside its test conditions and counting method. One result might compare entrance totals over a quiet interval; another might measure individual crossings during crowded, two-way traffic. Ask what counts as an error, whether entries and exits are assessed separately, and how the reference count was produced. Without those details, two systems displaying the same percentage may not be directly comparable.
What is a people counter, and why does the type matter?
A people counter is a sensor or system that estimates how many people pass through, occupy or move within a space. Its technology determines what it detects: a beam registers a crossing, a camera interprets a scene, and Wi-Fi tracking detects devices rather than counting every person directly. A doorway total and a room occupancy estimate, for example, answer different operational questions.
How accurate are people counting sensors by technology?
Listed accuracy ranges include stereo cameras at 95-99%, infrared beams at 90-95%, thermal sensors at 96-98% under optimal ambient conditions, and LiDAR at 95-98%. Wi-Fi tracking is listed at 60-75%, and may detect only some visitors because it tracks devices. These figures come from differing test conditions, so treat them as indicative comparisons rather than a controlled ranking across technologies.
How do sensors perform in crowded entrances and two-way foot traffic?
Crowding causes people to overlap in a sensor’s field of view, while opposing flows can make direction harder to classify. A beam may register several people as one crossing; image-based systems may lose sight of people behind others. Bidirectional counting can report entries and exits separately, but depends on correctly classifying direction. Compare each direction with observed movement, especially where queues merge with people leaving through the same entrance.
How does accuracy vary with doorway width, mounting height, lighting and weather?
Doorway width and mounting height shape the area a sensor can see and whether people cross its detection zone clearly. A wide entrance may need different positioning or coverage from a narrow doorway. RGB cameras rely on usable visible images, while thermal performance can be affected by high ambient heat, particularly above around 28-30°C. Outdoors, changing light and weather add further conditions to assess at the installed location.
Which independent tests compare sensor accuracy, and how were they conducted?
A useful independent comparison gives each sensor the same counting boundary, observation periods and reference method. Record device totals alongside simultaneous manual observations, then report differences for quiet and busy intervals separately. Include the entrance layout, direction of travel and crowd conditions so readers can interpret the results. Testing different sites or using different counting rules for each sensor won’t show whether the technology explains the difference.
What causes inaccurate counts, and how can they be reduced?
Common causes of counting errors include overlapping visitors, blocked views, poor sensor placement, changing light or heat, and inconsistent counting rules. Before a trial, define entries, exits and exclusions, then apply those rules consistently. Review differences by time and direction rather than relying on daily totals alone. Repeat the assessment after changes to the entrance layout, sensor position or visitor flow, as these can affect what the device detects.
Retail and shopping centres
Find out what your entrance data should be telling you
In 20 minutes we review your entrances, current counting setup and conversion questions, then tell you what accurate footfall data would change. No obligation, no hard sell.