A footfall count is only useful when it reflects the people who actually entered. Customer counter accuracy measures how closely a system’s recorded count matches a manual count of real visitors. Thermal sensors are described as 80-90% accurate, while camera-based systems are described as 95%+; real-world performance depends on the technology and conditions at the entrance.
A counter’s total may look like a reliable starting point, but errors can distort conversion rates and other retail measures. For retail teams, customer counter accuracy matters because missed or falsely recorded visits can make performance appear stronger or weaker than it is.
This article explains how to assess footfall data, compare counting technologies and interpret accuracy under different traffic conditions. It also explains why missed people and false detections should be considered separately, and how site-based comparisons can help establish whether customer counter accuracy is sufficient for decision-making.
Key Takeaways
- Compare recorded footfall with a manual count to understand how closely the system reflects actual entries.
- Assess performance across different traffic levels and entrance conditions, not just during quiet periods.
- Separate missed people from false detections, as the two types of error can cancel each other out in a total.
- Consider how the counting technology responds to lighting, obstructions and groups moving through an entrance.
- For retail footfall monitoring, explore Smart Urban Sensing’s AI 3DPro2. Contact the team at sales@smarturbansensing.co.uk.
❓ What is people counter accuracy?
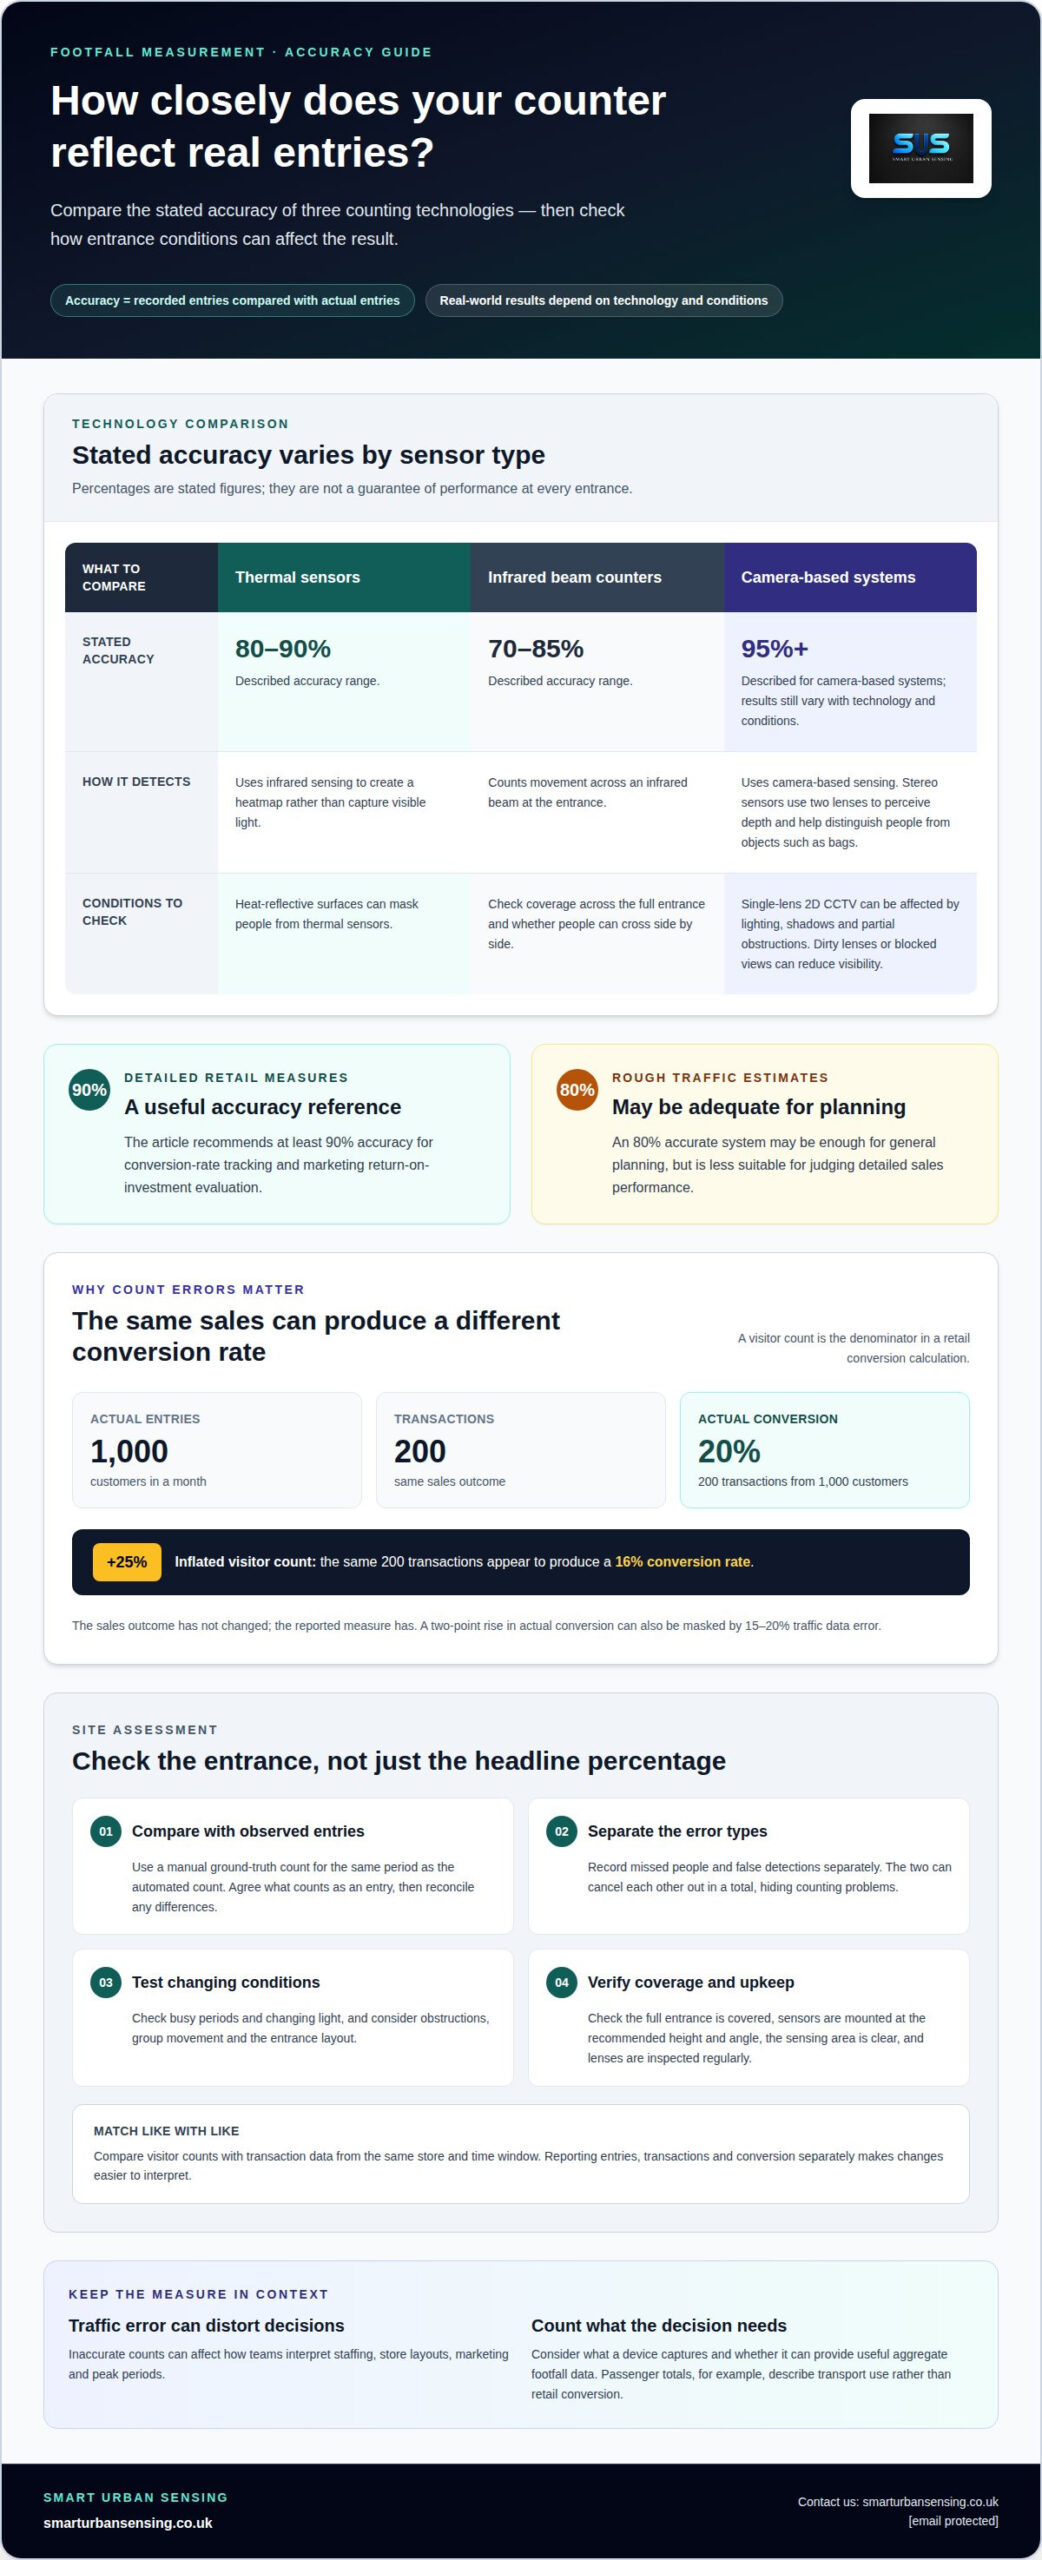
People-counter accuracy is how closely a system’s recorded entries match the people who actually cross an entrance. Thermal sensors are described as 80-90% accurate, infrared beam counters as 70-85%, and camera-based systems as 95%+; CCTV performance can still vary with its technology and conditions.
Sensor technology and counting accuracy
Sensor technology determines what a counter detects and how it distinguishes people from other movement. Single-lens 2D CCTV can be affected by lighting, shadows and partial obstructions, although machine-learning and computer-vision advances have addressed earlier monocular-camera accuracy problems. Stereo sensors use two lenses to perceive depth, helping distinguish people from objects such as bags. That distinction matters when a retailer uses a count to assess staffing or calculate a conversion rate: detection errors can change the figures behind those decisions.
Accuracy guarantees and monitoring
A stated accuracy percentage is most useful when you understand the conditions in which it was measured and how performance is monitored. Check whether testing covered the actual entrance, busy periods and changing light. Compare reported totals with observed entries, and look for separate figures for missed people and false detections. A report that explains the method and conditions gives retailers a more useful basis for judging whether the data supports operational decisions.
Environmental effects on sensors
Environmental conditions can affect what sensors detect, even when the technology stays the same. Heat-reflective surfaces, for example, can mask people from thermal sensors. Optical systems may lose visibility when lenses are dirty or the view is obstructed. Check that sensors are mounted at the recommended height and angle, keep the sensing area clear, and inspect lenses regularly. These checks help distinguish changes in footfall from changes in the sensor’s operating conditions.
Entry width and sensor coverage
Entry width affects how much space a sensor must cover and how people move through its detection area. A 1-metre, single-file doorway presents a different counting challenge from a 4-metre mall entrance, where visitors may cross side by side. Check that the installation covers the full entrance, rather than assuming one position will capture every path. If the sensing area leaves a gap, people crossing there may be missed; if the entrance is obstructed, the recorded count may also diverge from actual traffic.
How inaccurate visitor counts affect conversion rates and retail metrics
Visitor count is often the denominator in a retail conversion calculation. If a counter overstates or misses actual entries, the resulting conversion rate reflects the device’s count, not necessarily store performance.
For customer counting in the UK, GDPR is a relevant data protection regulation. Consider what each device captures and whether it can provide useful aggregate footfall data. Thermal counters use infrared cameras to create a heatmap rather than capture visible light.
The effect can be clear in a simple example. If a store records 200 transactions from 1,000 actual customers in a month, its conversion rate is 20%. If the device inflates that visitor count by 25%, the same transactions appear to produce a 16% conversion rate. The sales outcome hasn’t changed, but the reported measure has.
Inaccurate counts can distort decisions about staffing, store layouts and marketing. A campaign may seem to attract low-quality visitors if the counter records extra entries. A busy period may appear quiet if it misses groups entering together. Event organisers and facility managers also use visitor totals to understand how spaces are used, so inaccurate counts can misrepresent demand and peak periods.
For retail analytics, the research recommends at least 90% accuracy for conversion-rate tracking and marketing return-on-investment evaluation. Even modest improvements can be difficult to see: a two-point rise in actual conversion can be masked by 15-20% traffic data error. For rough traffic estimates used in general planning, an 80% accurate system may be adequate, but that level is less suitable for judging detailed sales performance.
Integrating footfall data with retail systems is useful only when the figures cover comparable locations and time periods. Match visitor counts with transaction data from the same store and time window, then distinguish changes in sales from changes in measured traffic. Reports that separate entries, transactions and conversion make shifts easier to interpret. A bus passenger counter serves a different purpose: passenger totals describe transport use, not retail conversion.
If you’re assessing footfall data for retail decisions, discuss your counting requirements or email sales@smarturbansensing.co.uk.
❓ Can this method work for manual or camera-based counting systems?
Yes. A manual ground-truth count can assess camera-based systems and automated door counters by comparing recorded entries with people observed crossing the entrance. Customer counter accuracy is measured by how closely the totals agree.
Ground-truth counting and reconciliation
Ground-truth counting means independently recording actual entries to create a reference for the automated count. Two observers can tally each person entering, then reconcile any differences before comparing their total with the counter’s report.
Observers need a clear shared rule for what counts as an entry, such as crossing inwards through the defined entrance. This reduces differences caused by inconsistent tallying. Record the manual and automated totals for the same period, then note missed people and false detections separately. A department-store example recorded 99% of the manual count during quiet morning traffic, but only 88% during a high-density lunch peak.
Audits and manual count comparisons
An accuracy audit compares automated door-counter records with direct observation during a representative period. A useful on-site test lasts roughly four hours, divided into 15-minute buckets, so changes in crowd density are visible rather than hidden in one overall total.
Include at least one busy stretch, then repeat the audit on a busy day and a slow day. This helps show whether an entrance counter performs differently as traffic changes. For each bucket, calculate the error by subtracting the manual count from the counter count, then dividing by the manual count. Share the comparison with the vendor if results reveal a consistent issue.
Measuring customer counter accuracy
Customer counter accuracy expresses how closely the automated total matches the observed total. For aggregate accuracy, divide the discrepancy by total counted events, subtract that error rate from one, then multiply by 100 to express the result as a percentage.
For example, a counter recording 990 entries against 1,000 observed entries has a 1% aggregate count error. Compare stores or periods using the same counting rules, time buckets and traffic conditions; otherwise, differences may reflect the test rather than the device. Report missed people separately from false detections, because those errors can cancel in the total.
Improving customer counting accuracy
Make the comparison consistent: use two independent observers, define the entrance boundary and tally every inward crossing. Compare the automated count for the same time window, then inspect intervals where the manual and sensor totals differ. This gives teams a practical way to assess customer counter accuracy under changing conditions.
For comparisons across stores, apply the same protocol at each site and include quiet and busy conditions. In the department-store example, results changed from 99% in quiet morning traffic to 96% during medium-density late morning, then 95% as the afternoon crowd thinned. Those variations show why a single-period result may not represent everyday performance.
Using the method with different counting technologies
The same manual comparison can be used to test different hardware, but the reference count must match what each technology records. Compare equivalent entrance traffic and direction of movement to see where a system performs well or misses people.
People counters and 3D stereo vision
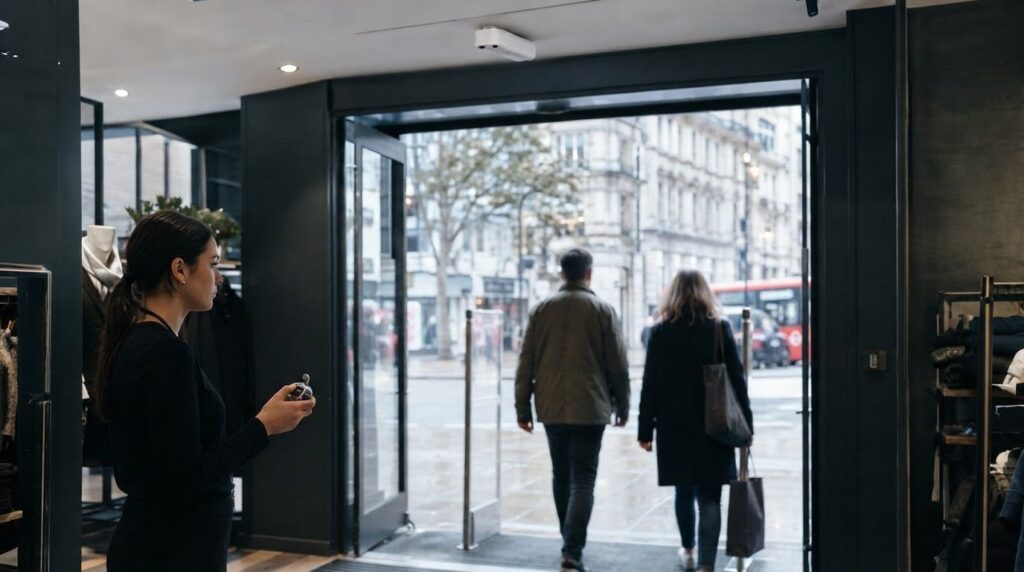
A 3D stereo-vision counter uses two lenses to perceive depth and interpret movement through an entrance. That depth information can help distinguish people from objects such as bags, which matters when shoppers carry bulky items or move in groups. After installation, compare its inward and outward totals with observed crossings. This shows whether the counter’s directional readings match the movement people actually make.
For a fair comparison, record the same time window manually and electronically. Note conditions that may affect the result, such as a crowded entrance or an obstruction in the sensor’s view. Stereo counters generally provide accurate counts when installed correctly, but a site-specific test shows how the hardware performs at that location.
Modern analytics and counting technology
Modern analytics use machine-learning and computer-vision algorithms to interpret camera images and identify movement. Recent advances have addressed accuracy problems associated with monocular cameras. A manual audit can show whether the analytics count people consistently when traffic changes, rather than relying on a single overall figure.
Thermal counters use infrared cameras to capture a heatmap instead of visible-light images. Thermal counters may be useful where visible-light imaging is unsuitable, but their suitability should be assessed for the site. Compare their counts with observed entries under normal site conditions, including periods when heat-reflective surfaces could mask people.
Beam counters register interruptions to a beam, not individual people. Side-by-side visitors or groups may therefore register as fewer crossings. Repeated entries and exits, or objects breaking the beam, can also affect the total. During an audit, watch the entrance and record these events alongside the device readings.
For each technology, keep the manual tally, device count and time period together. Compare matching intervals, then distinguish missed people from false detections. This helps identify whether a discrepancy relates to crowd movement, sensor coverage or the counting method itself.
A laboratory result and an on-site acceptance test answer different questions. The first describes performance under test conditions; the second shows how the installed system handles the entrance, traffic patterns and lighting it encounters. Apply the same counting rules across intervals, including both quiet and busy periods, to see how the analytics respond as conditions change.
Accuracy and integrity of footfall data
A footfall total is only trustworthy when its accuracy and limitations are visible. A counter can record 100 entries and 95 exits, leaving a discrepancy of 5 counts. That difference may reflect misalignment, occlusion, movement, lighting, calibration errors or interference from infrared devices. The total alone doesn’t identify which events were missed or added, so data integrity depends on examining the underlying counts and conditions.
Separate missed people from false detections in every accuracy report. These errors can cancel each other out: a device might miss one visitor and falsely detect another, producing a total that appears correct. That apparent match can hide problems with directional counts or specific busy periods. A useful report shows each error type separately, making it easier to judge whether the data supports marketing analysis, conversion measurement or broader planning.
An accuracy claim also needs context. People-counter vendors commonly publish figures between 95 and 99 per cent, but the conditions behind those figures may not be disclosed. A laboratory result and a site-specific acceptance test answer different questions. The latter shows how the installed counter performs at a real doorway, with its actual traffic, lighting, entrance layout and mounting height.
Choose the accuracy level according to the decision. Stable accuracy of 95 per cent is described as sufficient for directional footfall trends, while an 80% accurate system may suit rough traffic estimates for general planning. By contrast, a count differing from manual observation by more than 10% is too unreliable for conversion analytics. The appropriate threshold therefore depends on whether the figure guides broad planning or measures retail performance.
Overall averages can conceal inconsistent results. A counter averaging 98 per cent accuracy may range from 85 to 100 per cent across test periods, making it unreliable during busy stretches. A result recorded at 10 people an hour may not represent performance at 400 people an hour. Review performance across different traffic levels, and avoid treating a quiet-period result as proof of consistent accuracy.
Installation and ongoing condition also affect data integrity. Misalignment, obstructions and dirty lenses can alter detection, so check the mounting height and the doorway’s full sensing area when counts shift. Record changes to sensor position and operating conditions alongside the data. This helps distinguish a genuine footfall trend from a change in the system or its environment.
For a clearer view of how counting requirements relate to trustworthy footfall data, discuss your people-counting requirements or email sales@smarturbansensing.co.uk.
Smart Urban Sensing: AI 3DPro2
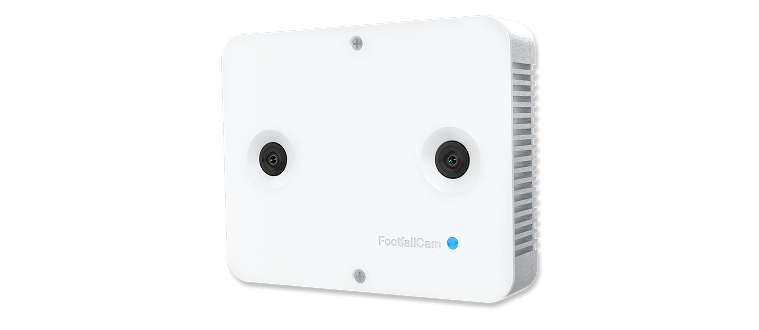
Smart Urban Sensing Ltd’s AI 3DPro2 is a people-counting option for retailers assessing entrance traffic and footfall data. Its systems use 3D stereoscopic, thermal and infrared sensors, with accuracy of up to 99.9%, and privacy-first, GDPR-compliant design. The right measure of performance remains the count recorded at your own site, compared with observed entries across representative conditions.
Consider AI 3DPro2 when you need retail footfall data to support analysis of customer flow or conversion, and want to assess a system against your entrance and operating conditions. For a different retail requirement, Smart Urban Sensing Ltd also offers AI 3DPro1 and Retail Starter Kits.
To discuss your people-counting needs, contact Smart Urban Sensing Ltd or email sales@smarturbansensing.co.uk.
Make your next footfall decision with confidence
Assessing customer counter accuracy helps strengthen decisions based on visitor data. Set a clear purpose for each dataset, whether it supports store planning, staffing or customer-flow analysis. A consistent assessment also helps teams understand how the figures were checked and what they can reliably support.
For your next step, match your measurement goals to a system suited to your retail environment. Smart Urban Sensing offers AI 3DPro2, AI 3DPro1 and Retail Starter Kits. Discuss how customer counter accuracy can support the decisions your organisation needs to make.
Contact Smart Urban Sensing or email sales@smarturbansensing.co.uk to explore the next step for your organisation.
Frequently Asked Questions
Can I trust a vendor’s published accuracy number?
Treat a published accuracy number as a starting point, not a guarantee of performance at your entrance. Vendors commonly publish figures between 95 and 99 per cent, but testing conditions may not be disclosed. Ask what the result measures, and compare it with a site-based count covering the traffic patterns and lighting your store experiences. A high average can hide lower performance during busy periods.
How accurate is good enough?
Good enough depends on the decision the data will support. An 80% accurate system may suit rough traffic estimates for general planning, while 95% accuracy can be sufficient for directional footfall trends. Retail conversion analysis needs stronger data: at least 90% accuracy is recommended for conversion tracking and marketing return-on-investment evaluation. Match the threshold to the consequence of acting on an inaccurate figure.
What features should I look for when choosing a people counting sensor for persistent indoor use?
Choose technology suited to the entrance, its lighting conditions and the directional counts you need, with a way to assess results over time. For an indoor site, consider whether the system distinguishes people from objects and handles groups crossing together. Check that the sensor can cover the entrance without obstructions, and consider ongoing maintenance, technical support and compatibility with modern technologies.
What is a visitor counter?
A visitor counter records people entering or moving through a defined space. In a shop, its count can show visitor patterns by time or day; a facility manager might use it to understand how an area is used. The figure represents detected crossings, not necessarily unique individuals, so repeat visits can add multiple entries.
What is an entrance people counter?
An entrance people counter is a sensor or system positioned to register crossings at a doorway or access point. Depending on its capabilities, it can record entries and exits separately, giving operators a view of directional movement. Comparing entry and exit totals, for example, can reveal an imbalance to investigate. The net figure should not automatically be treated as the number of people inside.
What does customer counter accuracy mean?
Customer counter accuracy describes how closely a system’s count reflects observed customer crossings. It matters because footfall data informs decisions beyond visitor totals, including staffing plans and conversion analysis. If a store’s count changes after a sensor is repositioned, compare it with observed entries before interpreting the change as a shift in customer behaviour.
What is a good customer counter accuracy rate?
There isn’t one suitable rate for every use. For retail analytics, at least 90% accuracy is recommended for conversion tracking and marketing return-on-investment evaluation; 95% can be sufficient for directional trends. A rate should also be stable across the conditions that matter to your store. Review performance by time period, rather than relying only on one combined score.
What technologies are used to count customers accurately?
Common approaches include optical cameras, 3D stereo vision, thermal sensors and infrared beam counters. Stereo systems use two lenses to perceive depth; thermal sensors detect heat patterns, while beams register interruptions. Each method responds differently to entrance layout, groups and environmental conditions. Mobile-phone tracking isn’t appropriate for counting the specific number of store visitors or calculating store conversion rates.
Retail and shopping centres
Find out what your entrance data should be telling you
In 20 minutes we review your entrances, current counting setup and conversion questions, then tell you what accurate footfall data would change. No obligation, no hard sell.