What if the footfall trend you need is hidden because Excel has read a date column as text? A practical workflow for exporting footfall data to Excel is to select a report or dashboard view, use its export or download option to save a spreadsheet-compatible file, then check how Excel has imported the date and time fields.
A spreadsheet export may not be ready to analyse straight away. Choosing the right date range and measures, and keeping date and time values consistent, makes reports easier to sort, compare and use for trend analysis.
This guide explains how to export report, trend and dashboard data as CSV or Excel files, then organise the spreadsheet for analysis. You’ll learn what to select before exporting, how to open and structure the file, and how to format date and time columns so the information is clear and useful.
Key Takeaways
- Choose the report, dashboard view and date range that match the analysis you need before exporting.
- Format date and time columns consistently so spreadsheet tools can sort records and reveal trends accurately.
- Use CSV or Excel exports according to how you plan to open, organise and share the data.
- Check how drag-and-drop export handles selected measures and fields before building a repeatable workflow.
- For ongoing footfall insight, explore how Smart Urban Sensing’s real-time data offering could support your reporting needs.
Formatting date and time columns
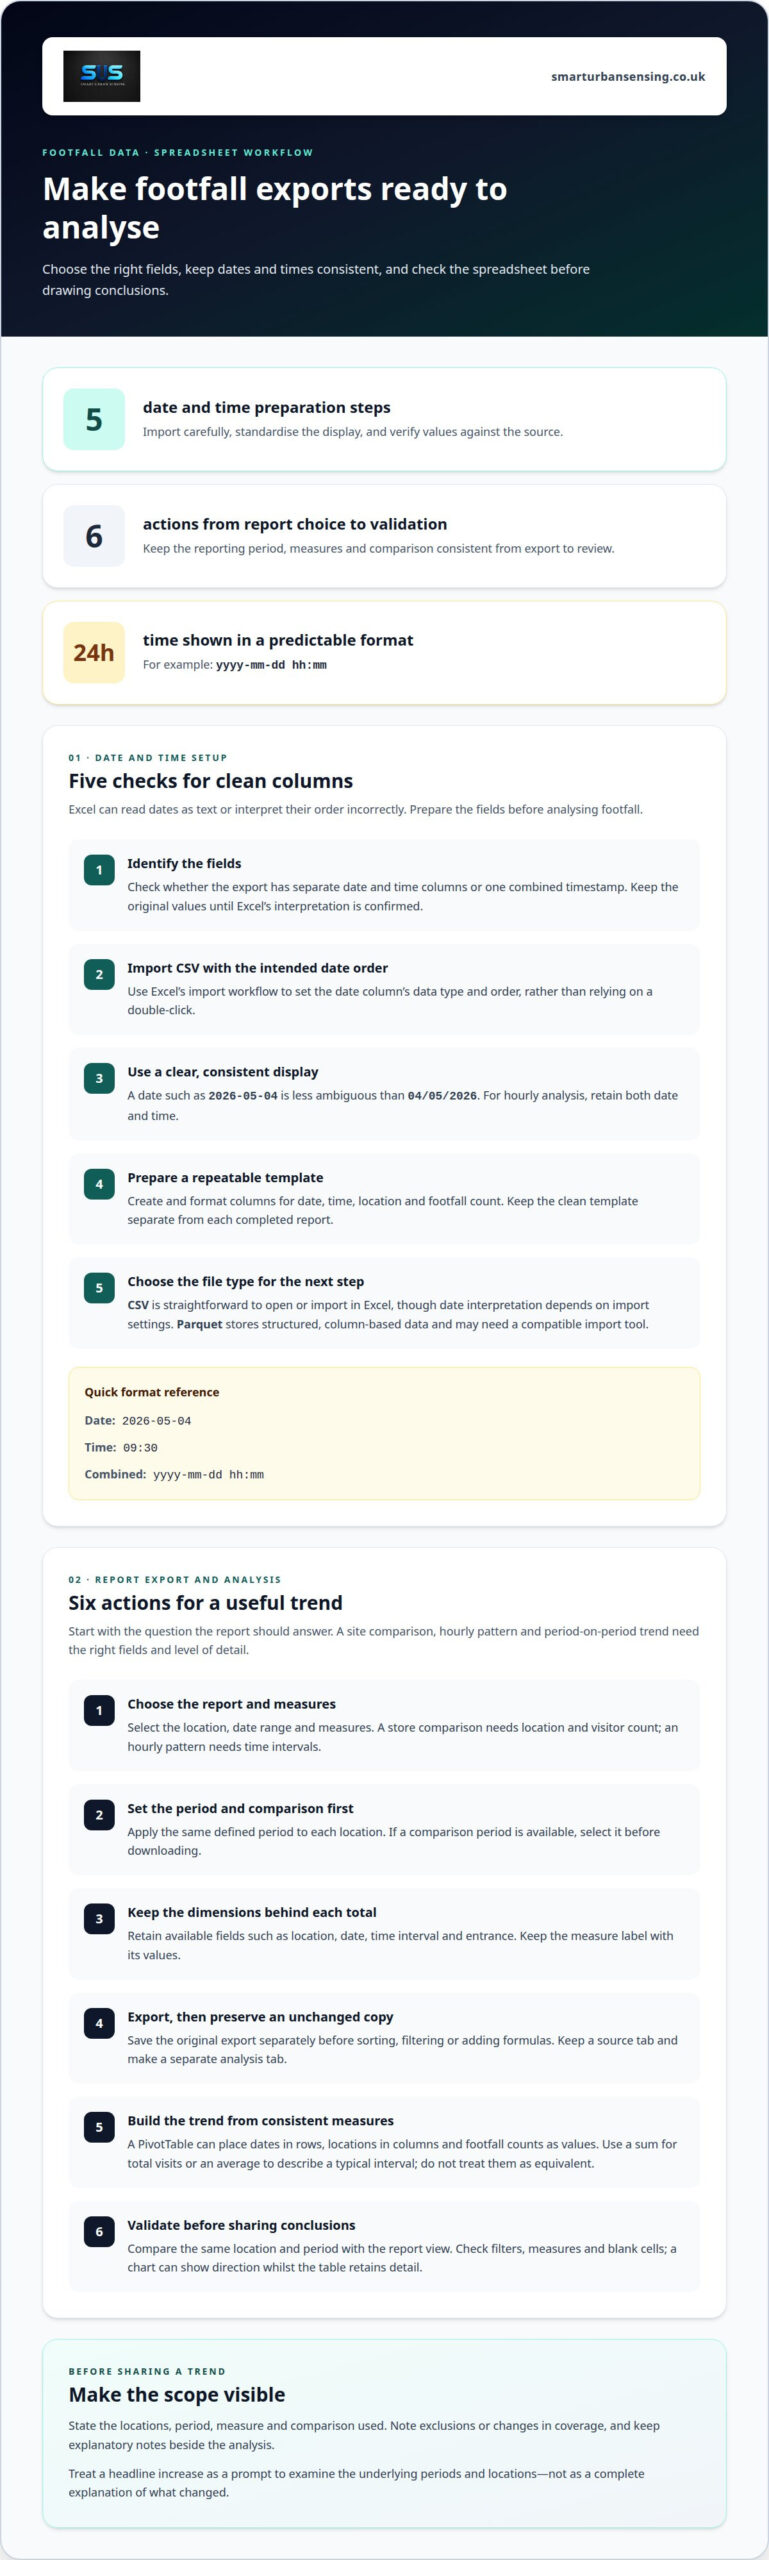
Excel may display exported dates as text or interpret them in the wrong order. Before analysing footfall, set a consistent date and time format so records sort chronologically and hourly trends remain clear.
Common errors include ambiguous dates such as 04/05/2026, text values that won’t sort as dates, and times displayed without their dates. Correct them by importing the column with the intended order, converting text to date-time values, and applying one consistent display format.
- Identify the date and time fields before opening the file. In a CSV feed, check whether dates and times use separate columns or a combined timestamp. For example,
2026-05-04and09:30are easier to interpret consistently than04/05/2026 9.30am. Keep the original values available until you’ve confirmed Excel has recognised them correctly. - Import CSV data with the right date order. Open Excel’s import workflow rather than relying on a double-click, then set the date column’s data type and order. A value such as
04/05/2026can mean 4 May or 5 April, depending on interpretation. Use an unambiguous year-month-day example, such as2026-05-04, when the feed supports that format. - Apply a consistent display format to date-time values. Select the relevant Excel column and choose a format such as
yyyy-mm-dd hh:mm. This displays the year, month, day and 24-hour time in a predictable order. For a daily report, format dates without the time; for hourly footfall analysis, retain both fields so records can be grouped by date and time. - Use a pre-formatted Excel template for repeat exports. Create columns for date, time, location and footfall count, then format each field before adding data. Save a clean template separately from each completed report. When you download the next CSV, import its rows into the matching columns instead of rebuilding formats and formulas each time.
- Choose CSV or Parquet according to the next step. CSV is a straightforward text format that can be opened or imported in Excel, but date interpretation depends on the import settings. Parquet stores structured, column-based data and may need a compatible import tool before Excel can use it. After importing either format, check a sample date, time and count against the source values.
Exporting report data and trends to spreadsheets
Start with the question your report needs to answer. A site comparison, hourly pattern and period-on-period trend each require different fields and levels of detail.
- Choose the report and measures that match your analysis. In the reporting platform, open the relevant footfall report or trend view, then select the location, date range and measures. For a store comparison, include location and visitor count. For an hourly pattern, include time intervals. Avoid exporting every available field if it obscures the measure you need to interpret.
- Set the period and comparison before exporting. Choose a defined reporting period, such as a calendar week or retail campaign, and apply the same period to each location. If the dashboard offers a comparison period, select it before downloading. A table containing current and comparison values makes changes easier to review than separate exports with different date ranges.
- Retain the dimensions that explain each total. Include fields such as location, date, time interval and entrance where available. These dimensions help distinguish a change at one entrance from a site-wide movement. Keep the measure’s label with its values, so “entries” isn’t confused with another count when the spreadsheet is shared.
- Export the selected view, then preserve an unchanged copy. Use the report’s export or download control and choose a spreadsheet-compatible format. Save the original export separately before sorting, filtering or adding formulas. For example, keep one source tab and create another analysis tab. This gives you a clear reference if a calculated result or chart needs to be traced back to its source rows.
- Build trend analysis from consistent measures. In Excel, turn the exported range into a table, then create a PivotTable with dates in rows, locations in columns and footfall counts as values. Check whether to sum or average the measure: summing interval counts can show total visits, while an average can describe a typical interval. Don’t compare totals with averages as if they were equivalent.
- Validate the spreadsheet before sharing conclusions. Compare a selected location and period in Excel with the same report view. Check that filters include the intended rows, totals use the same measure, and blank cells haven’t been treated as zero. A simple chart can show the direction of change over time, while the underlying table retains the detail needed to investigate it.
If you need help shaping footfall reporting around your analysis, contact the team or email sales@smarturbansensing.co.uk.
Before sharing a trend, make the spreadsheet’s scope clear: identify the locations, period, measure and comparison used, and note any exclusions or changes in coverage. Keep explanatory notes beside the analysis so readers can distinguish a genuine movement from a change in how data was collected. Ripon BID reported a 164% year-on-year increase in footfall. Treat a headline increase as a prompt to examine the underlying periods and locations, rather than as a complete explanation of what changed. A chart paired with the exported detail can make the result easier to review and verify.
Drag-and-drop data export
A drag-and-drop export can help assemble a focused footfall dataset. Treat the selected fields as a report specification: location, date, time interval and count should each have a clear purpose.
- Open the export workspace and identify its available fields. Look for a panel of report dimensions and measures beside a blank canvas or table. Dimensions describe records, such as location and date; measures contain values, such as visitor counts. Knowing the difference helps prevent a field from being used in the wrong role.
- Drag a time field into the row or grouping area. Place date there for a daily trend, or use time interval to review the pattern within a day. If the interface lets you choose both, arrange date before time. This order keeps each interval associated with the correct day in the exported rows.
- Add the location dimension before the footfall measure. To compare sites, place location in the table and add the count as a value. The resulting rows can show each location separately rather than combining visits into one total. For a single-site report, retain the location field if you may later combine the export with data from other sites.
- Set filters before arranging the final columns. Apply the intended reporting period and select the required location or entrance. For example, a report for one shopping centre entrance shouldn’t include other entrances unless the analysis calls for them. Review the displayed filters, since a drag-and-drop layout can still produce an export with an unintended scope.
- Review the preview for missing or duplicated fields. Check that each row has a recognisable date or location and that the footfall measure appears once. A total repeated beside every time interval may be a summary value, not an interval count. Remove redundant totals before exporting to avoid adding them repeatedly in Excel.
- Export the finished layout and preserve its field order. Choose the available spreadsheet format, then retain the headings and sequence in the downloaded file. For example, location, date, interval and count make a readable structure for filtering or a PivotTable. Save the layout where the platform supports reusable configurations, so later reports can follow the same specification.
If a drag-and-drop layout needs tailoring to a footfall reporting workflow, contact the team or email sales@smarturbansensing.co.uk with the report fields you need.
Exporting dashboard data as CSV
A CSV export captures dashboard data in a plain-text table. Before downloading, set the dashboard filters and decide whether you need chart values, underlying rows or both.
- Set the dashboard filters first. Choose the reporting period, location and measure before exporting. For example, a report for one shop shouldn’t retain a multi-site selection. Filters usually determine which records appear in the exported file, so review the visible selections and dashboard title together.
- Find the export option for the correct dashboard element. A dashboard may offer separate controls for a chart, table or complete view. Select the table when you need individual records for analysis; use chart data when the displayed series is the focus. If both are available, export them separately and label the files clearly.
- Choose CSV and save a working copy. Use the dashboard’s download or export control, then save the CSV with a descriptive name, such as
Central-Shop-April-Footfall.csv. Keep the original file unchanged. Open a separate working copy in Excel so filtering or editing doesn’t alter the source export. - Import the CSV through Excel’s data tools. Select the file through Excel’s import workflow and review the preview before loading it. Confirm that headings occupy separate columns and that values such as
1,250remain together as one count. If the preview places the entire row in one column, select the appropriate delimiter, such as a comma. - Check which dashboard values the CSV contains. Compare a row and a displayed total with the dashboard’s selected view. A CSV may contain the underlying table rather than visual elements such as colours or chart labels. For example, a chart showing weekday patterns may export dates and counts, but not its formatting.
- Look for totals, blanks and repeated headings. Review the first and final rows, then inspect the count column for blank cells or summary rows. If a total row is included alongside daily values, exclude it before calculating a grand total. Otherwise, Excel may count the summary twice.
- Record the export context with the file. Add a worksheet note or filename detail for the selected location, date range and measure. For example, “entries, Central Shop, April” distinguishes that export from a later report covering another site or period. This context makes reused dashboard data easier to interpret.
For support with footfall reporting workflows, contact the team or email sales@smarturbansensing.co.uk.
Exporting footfall data as CSV or Excel
Choose a format that suits the next step, then set the report’s date range and fields. The right export preserves useful detail without carrying unnecessary information into your analysis when exporting footfall data to excel.
Choose a platform with Excel export
Open the footfall platform’s report or dashboard and locate its export controls. Look for an explicit Excel workbook option or a CSV download that Excel can import. Check whether the control applies to a chart, table or full report, as each export may contain different data.
Platform features vary: an analytics dashboard doesn’t necessarily mean its data can be downloaded as Excel. Confirm the available file formats in the export menu before designing a recurring workflow.
Select a file format and date range
Choose Excel when you need a workbook for formulas, charts or a PivotTable. Select CSV when you need a simple table to import into Excel or another analysis tool. CSV carries rows and columns, but not workbook features such as formatting or multiple sheets.
Set the date range using the report’s available filters, then select the required locations and measures. Exporting a complete period supports comparisons, while a narrower range can make a focused review easier. Export frequency depends on when the dashboard data refreshes and when its reporting controls allow a new download.
For privacy-conscious handling in the UK, export aggregate counts rather than names, device identifiers or individual movement records. Remove fields the report doesn’t need and limit access to the resulting spreadsheet.
Check export limits and costs
Review the platform’s export screen and account terms for row caps, date-range restrictions, format options or charges. These conditions may depend on the platform, account settings and size of the requested export, so factor them into any recurring report.
After downloading, open the file in Excel and check that the expected rows and reporting period appear. Create a PivotTable with dates in rows, locations in columns and footfall counts as values. A line chart can show movement over time; a column chart can compare locations for a selected period.
Use the same measure and date range when comparing chart results with the source dashboard. For example, compare daily counts with daily counts, not a daily total with an average interval. Save the original export separately from the workbook containing your PivotTable or chart.
To discuss footfall reporting and analysis workflows, contact Smart Urban Sensing Ltd or email sales@smarturbansensing.co.uk.
Smart Urban Sensing: Real time Data
Smart Urban Sensing provides Real time Data for organisations that need footfall information to inform operational reporting and analysis. If spreadsheet exports are part of a wider need to understand customer movement, its AI 3DPro1 and AI 3DPro2 counters, alongside Retail Starter Kits, offer relevant options to explore.
The right approach depends on what you need to measure, where the counters will be used and how the resulting information fits your reporting workflow. Consider how footfall data will support decisions across your retail environment, rather than treating each spreadsheet as an isolated report.
To discuss a suitable footfall data approach, Book a free 20-minute footfall review or email sales@smarturbansensing.co.uk.
Make your next footfall report more useful
A spreadsheet is more valuable when it supports a clear operational decision, not simply when it contains more rows. Consider who will use the report, which movement patterns matter and how the findings could shape the next review. That purpose can guide a more consistent reporting process over time.
For teams exporting footfall data to Excel, the next step is to connect reporting needs with a suitable approach to people counting and analysis. Smart Urban Sensing’s AI 3DPro2, AI 3DPro1 and Retail Starter Kits can support organisations developing that approach.
Discuss your reporting requirements with Smart Urban Sensing. Contact the team or email sales@smarturbansensing.co.uk to explore a practical next step for your footfall data.
Frequently Asked Questions
How do you export footfall data to Excel?
Open the relevant footfall report, apply its filters and select the export option for Excel or CSV. For V9 Analytics Software, choose the report data you need, such as a location summary or time-based count, then download the selected output. Keep a source copy before making changes. This gives you a reference for checking calculations or investigating a difference between your spreadsheet and the original report.
What file formats can footfall data be exported in, such as XLSX or CSV?
Available formats include Excel, CSV and PDF, alongside data access through REST API or MQTT subscription. Choose Excel for workbook-based review, or CSV for a straightforward table to use in another tool. The listed format options don’t specify an XLSX extension, so select the Excel option shown in the platform rather than assuming a particular file extension. PDF suits sharing a fixed report, not working with rows of data.
How do you clean and format exported footfall data in Excel?
In Excel, remove rows that are clearly report titles or repeated headers before analysing the records. Use filters to spot blank location names, inconsistent labels such as “Shop A” and “Shop A ”, or duplicate entries. Keep a separate source sheet, then clean a working copy. For a useful final check, compare a selected location’s count with its value in the original report before sharing your analysis.
How often can footfall data be exported, and what date ranges are available?
Huq footfall data refreshes weekly. Reports can use a defined period, such as a calendar week or retail campaign.
Retail and shopping centres
Find out what your entrance data should be telling you
In 20 minutes we review your entrances, current counting setup and conversion questions, then tell you what accurate footfall data would change. No obligation, no hard sell.