
AI 3D APC — the automated passenger counter
Know exactly how many passengers boarded, where, and when
The AI 3D APC is a UK-built automated passenger counter fitted above each door, paired with a managed IoT gateway on the vehicle and a console that turns every boarding and alighting into per-stop demand you can plan a timetable around and defend in a funding claim. Anonymous, GDPR-compliant, and completely independent of your ticketing system.

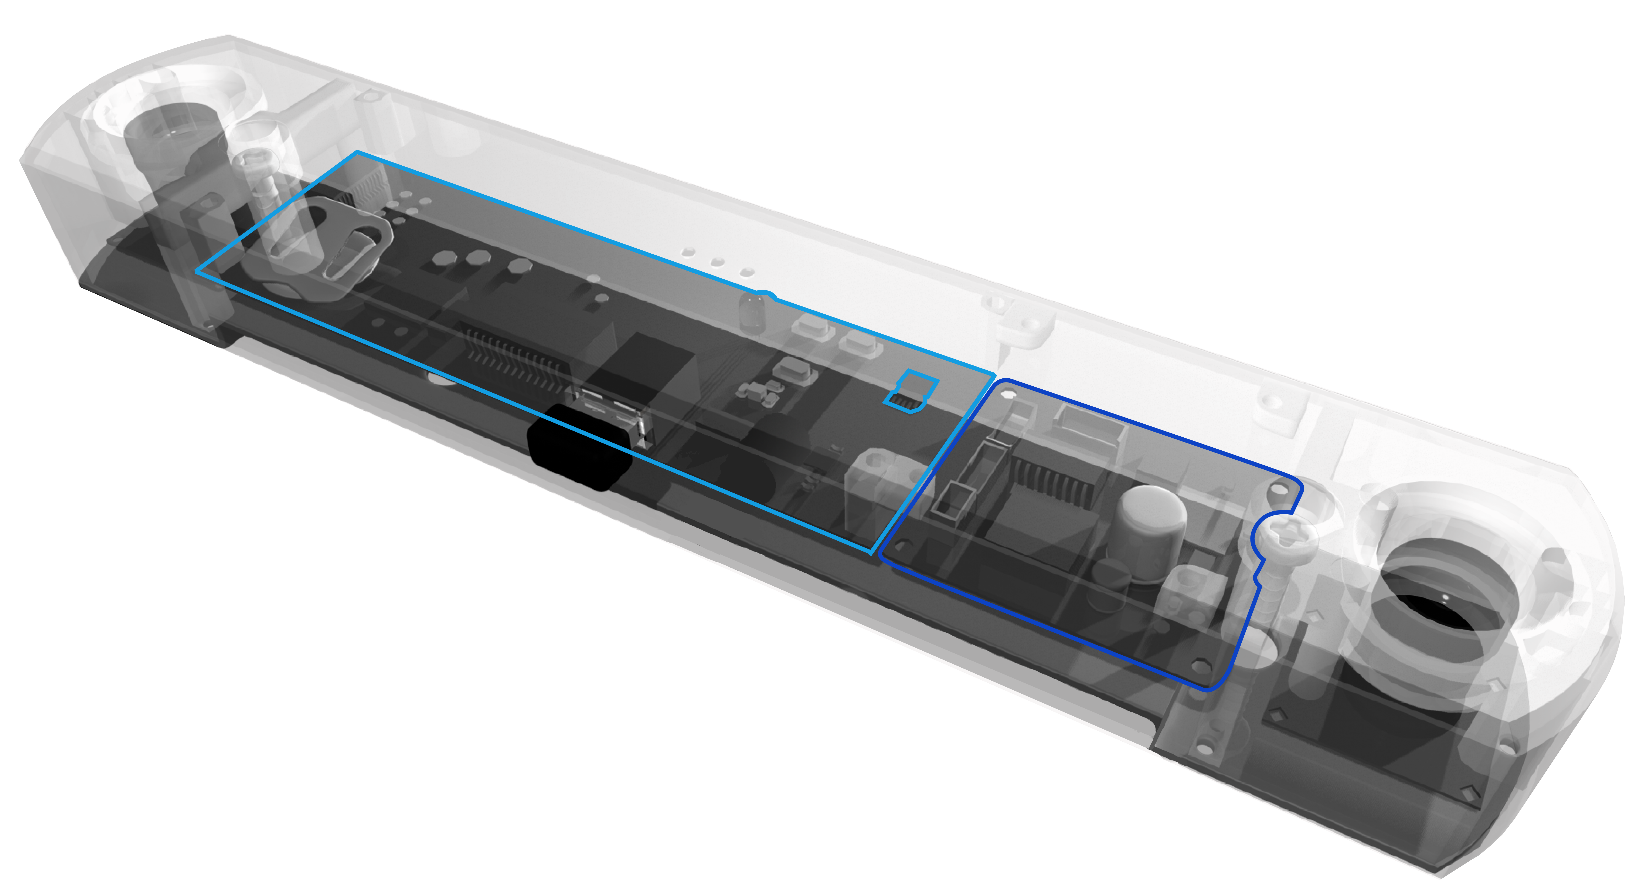
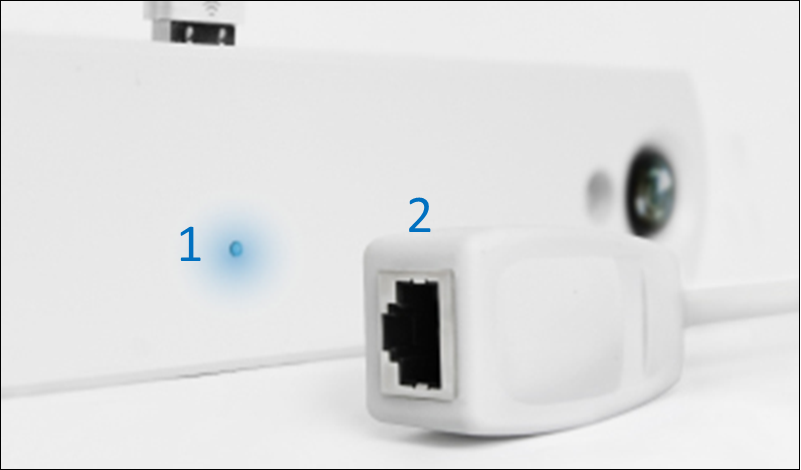
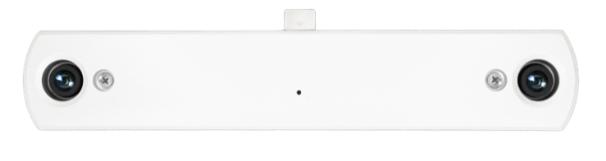
The AI 3D APC automated passenger counter: a sealed dual-lens 3D counter with its own GPU and quad-core processor, powered and connected by a single Cat5e run — engineered to live above a bus door rather than in a shop doorway.
How it counts
How our automated passenger counter sees: depth, not pixels

Stereoscopic vision, mimicking human eyes
Two lenses capture the same doorway from slightly different angles. The automated passenger counter combines those views into a depth map, so it counts by height and shape rather than by pixel movement. That is what separates an adult from a child, a pram or a suitcase — and what makes shadows, reflections and low winter sun a non-event rather than a phantom passenger.
Because the maths happens on the device, nothing about the passenger leaves the vehicle. In other words, only the count travels.

In and out, counted separately
Each doorway produces two independent streams — boardings and alightings — so onboard occupancy is a live subtraction rather than a guess. Because both directions are recorded, the two totals can be reconciled at the end of a trip: a healthy vehicle balances to within a percentage point or two, and a persistent imbalance is a diagnostic signal rather than something buried in the numbers.
Above all, nothing depends on a fare transaction or a driver action, which is precisely why the figure survives a service review. It counts concessionary travellers, contactless taps, pass holders and the people who never tap at all, identically.

One automated passenger counter per door, each with its own identity
A typical bus fit is one counter above each boarding point — Door 1 and Door 2 — each reporting under its own sensor identity. In practice that matters operationally, because a fault is traceable to a door rather than to a vehicle, and a door with a known-faulty feed is excluded from occupancy-derived figures until it is repaired, instead of quietly depressing your ridership.
Similarly, wider doors, double-width entrances and high-ceiling vehicles are covered by the same approach, sized at survey.
The complete system
What actually goes on the vehicle
Automated passenger counters at each door, a control box holding the cellular and GPS connection, and a driver dashboard if you want one — wired once, managed remotely, and publishing to the cloud on every operating day.

An automated passenger counter at every door
One AI 3D APC automated passenger counter above each boarding point, counting in and out on the device. Additional doors are added without changing the data path.
Control box and gateway
Meanwhile the control box carries the cellular uplink, GNSS position and PoE power for the sensing estate, publishing over MQTT with TLS and a per-vehicle identity.
Driver dashboard, optional
Optionally, a simple in-cab display shows live onboard occupancy against capacity, if your operation wants the driver to see it.
Counting-only option
Prefer to keep your own systems? Take the counters and feed our data into your existing platform through the API instead.
CCTV, optional
A 360° fisheye HD camera with a 64 GB card can sit in the same unit, under your own retention policy — separate from, and not required by, counting.
Wi-Fi analytics, optional
Wi-Fi presence analytics can run alongside video counting where you want a second signal on the same hardware.
Accuracy
A number is only worth what its method is worth
Every automated passenger counter we install is validated on your own vehicles: we work to 99% per door and prove it per installation rather than asserting it in a brochure. Accuracy on your fleet depends on door geometry, mounting height and how your passengers actually board, so the validation plan is agreed before anything is ordered and the measured result is recorded per door and per route.
What normally goes wrong, and what we do about it
| What normally breaks a counter | How our automated passenger counter handles it |
|---|---|
| Two people abreast, or tailgating | Depth separation resolves overlapping bodies as distinct height profiles rather than one blob. However, that is exactly the failure mode that flatters beam and single-camera counters at peak. |
| Prams, luggage, shopping trolleys | For example, objects are discriminated by height and shape, so a pram is not counted as a passenger and a passenger pushing one is not counted twice. |
| Children | Height thresholds are configurable per operation. Therefore a policy on counting children is applied consistently across the whole fleet, rather than left to the sensor. |
| Sunlight, shadow and reflections | Because depth is derived from geometry rather than brightness, low winter sun through a doorway and wet reflective flooring do not create passengers. |
| Passengers hesitating in the doorway | Direction is resolved across the counting line rather than per frame. As a result, someone stepping back and forward in the doorway nets to a single crossing. |
| A power cycle mid-shift | Stored records are aggregated from persisted daily data, not read from a cumulative sensor counter, so a restart does not reset the day. |
| A dead door feed | Instead, it is reported as an incomplete vehicle and excluded from occupancy-derived figures until repaired, rather than showing up as a genuinely quieter route. |
| A cellular dead spot | Meanwhile, messages queue on the vehicle and arrive late with their source timestamps intact, so the record is complete even when the connection was not. |
How validation is actually done
Manual observation counts are taken alongside the system on the routes and at the times that stress it — peak boarding, wet weather, heavy luggage — then compared per door and per direction. The result, the method and the sample are written down and signed. You hold that record before any fleet commitment is made, and once a counter has been verified its accuracy does not drift, because the depth calculation depends on fixed lens geometry rather than on a trained scene.
Inside the unit
Everything that has to survive five years above a door
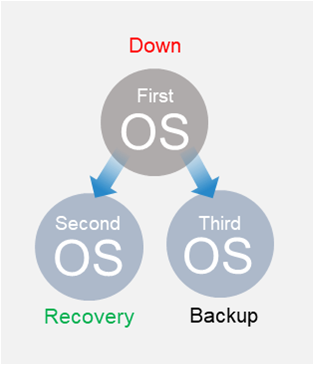
Vibration, door slam, temperature swing, dust and a network that comes and goes. These are the parts of the automated passenger counter that deal with it.

Built to be left alone
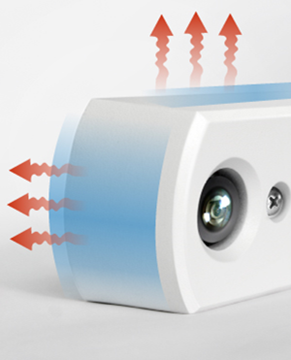
A 25-year mean time to failure, a compact vibration-proof casing rated for buses, trams, tubes and trains, and an optional 360° fisheye HD camera with a 64 GB card for on-board recording under your own retention policy.

Fitted centred above the door header and aligned to the passenger threshold. One vehicle first, validated and signed off, before any fleet commitment. Illustrative installation photograph.
On the vehicle
Where the automated passenger counter goes, and what it watches

Counting zone and line shown on an illustrative saloon photograph. Zone geometry is configured per vehicle layout at commissioning.
Above the threshold, out of the way
The automated passenger counter sits flush to the ceiling directly above the boarding point, looking straight down at the threshold. Therefore mounting position, header clearance and cable route are all surveyed before anything is ordered, because that geometry is what the accuracy depends on.
In addition, cabling is loomed back to a secure equipment area where the gateway lives on vehicle power. Nothing hangs in the saloon, nothing is accessible to passengers, and the whole build is repeatable per vehicle to a documented specification.
Commissioned before it returns to service
Sensor identities, topics and credentials are configured, TLS certificates issued, and cloud data confirmed arriving end to end — then counts are checked against manual observation per door and per route, and the result is recorded and signed.

IoT infrastructure gateway
The SUS AI Gateway: one connection for every automated passenger counter on board
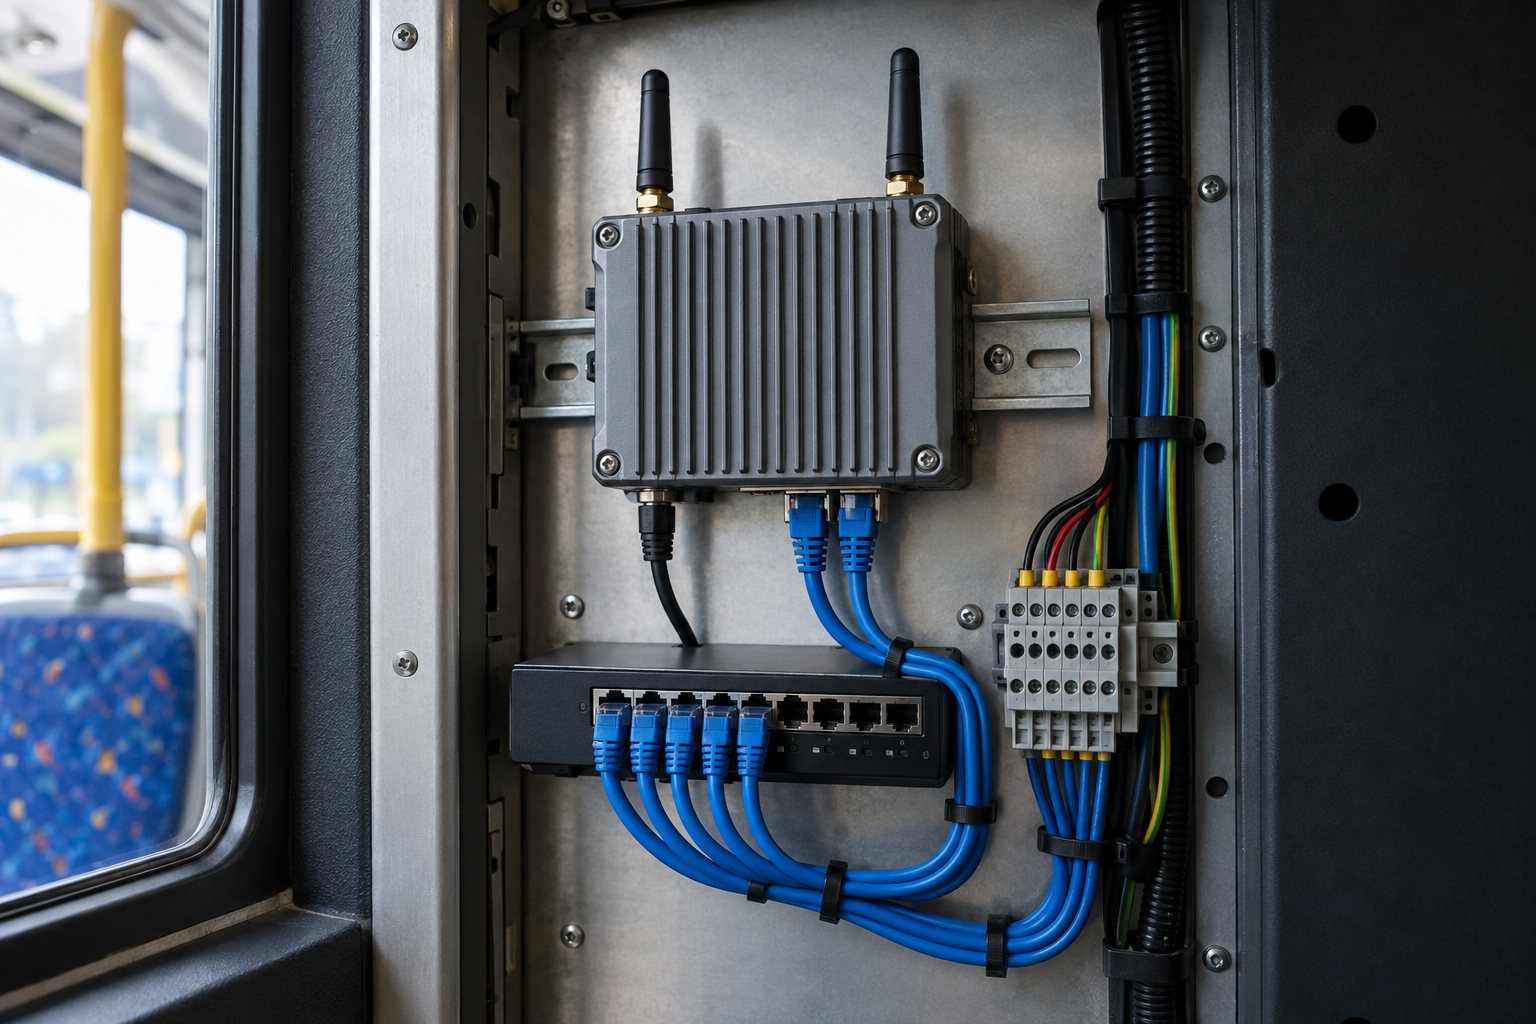
Every automated passenger counter on the vehicle terminates at one managed gateway. It powers the estate over PoE, holds the cellular connection, supplies GNSS position for stop matching, and publishes to the broker over TLS with a per-vehicle identity.
- Cellular uplink. 4G/5G with a fitted SIM, validated through to the cloud at commissioning.
- PoE distribution. Powers and connects the counters over structured cabling.
- GNSS position. Vehicle location for GPS proximity matching of counts to stops.
- Secure publish. MQTT over TLS, CA-signed certificates, least-privilege per-vehicle topics.
- Store and forward. Messages queue through tunnels and dead spots and arrive with source timestamps intact.
- Remote management. Signal quality, uptime, firmware and configuration without a depot visit.
Measured in service, not on a bench
From a monitored deployment window: 8,171 gateway samples, 100,098 messages ingested by the broker, median RSRP −88 dBm, median SINR 7 dB, 100% broker uptime. Counting publishes on a one-minute cadence as line-trigger, line-periodic, line-total and region records — event detail plus a self-correcting periodic total, so a single lost message never becomes a lost hour.
Door to decision, in four steps

The SUS Bus Console
The software is the product you live with
Counting hardware is the easy half. What an operations team uses every day is the interface that sits above every automated passenger counter on the fleet — occupancy now, demand by stop and hour, journey playback, door balance and feed health, all answered from stored records rather than a live counter that resets when a vehicle restarts.


Fleet overview at a glance
Boardings by hour
Two clear peaks, drawn from stored boarding records matched to stops by GPS proximity — the pattern you need to move a departure or defend a frequency.
Feed health
- Bus 001 · live · 12s ago
- Bus 002 · live · 41s ago
- Bus 003 · stale · 52m — flagged
- Bus 004 · shift ended · expected
Door balance today
- Bus 001 Door 1 · 412 in · 405 out
- Bus 001 Door 2 · 0 in · 398 out
- Bus 003 Door 2 · no data — excluded
Illustrative layout with demonstration data. A live instance is shown on request under NDA.
Ridership on every timescale
First, the totals: daily, weekly, monthly and yearly, with route and vehicle filters, plus charted comparisons between vehicles. Long periods are summed from stored daily records, so a year figure is the sum of what actually happened.
Journey and map playback
Replay a vehicle's journey against its stops and counts. Every stored position carries provenance, and stale coordinates lapse rather than being drawn on a map as current.
Saloon heatmaps
Notably, heatmaps show where passengers actually stand and sit, which is useful for layout, wear, door choice and accessibility planning.
Data quality in the same view
Crucially, feed liveness, per-door balance and expected shutdowns sit next to the numbers, so nobody mistakes an outage for a quiet Tuesday in a board paper.
Exports and monthly summaries
PDF, Excel and CSV, plus a monthly value summary written for a management meeting rather than for an engineer.
Roles and audit trail
Finally, role-based access keeps a record of who looked at what and when — the part that matters when a figure is later questioned.
What the data answers
The questions you cannot currently answer with a logbook

In short, per-door counts matched to stops turn a series of opinions into a record. These are the decisions operators bring us first.
- Frequency. Which departures are genuinely full, and which are running for three people.
- Timetable. Where the peak actually sits, hour by hour and stop by stop.
- Capacity. Whether a route needs a bigger vehicle or another vehicle.
- Stop performance. Which stops earn their dwell time and which could be consolidated.
- Funding and reporting. Auditable ridership evidence for subsidy, tender and performance claims, reported on the same basis as the Department for Transport's annual bus statistics.
- Revenue assurance. Boardings against ticketing, to see the gap rather than assume it.
What it replaces
The paperwork you are currently defending decisions with


Automated passenger counters across the fleet, not just the bus



Passenger counting for bus operators, on one page
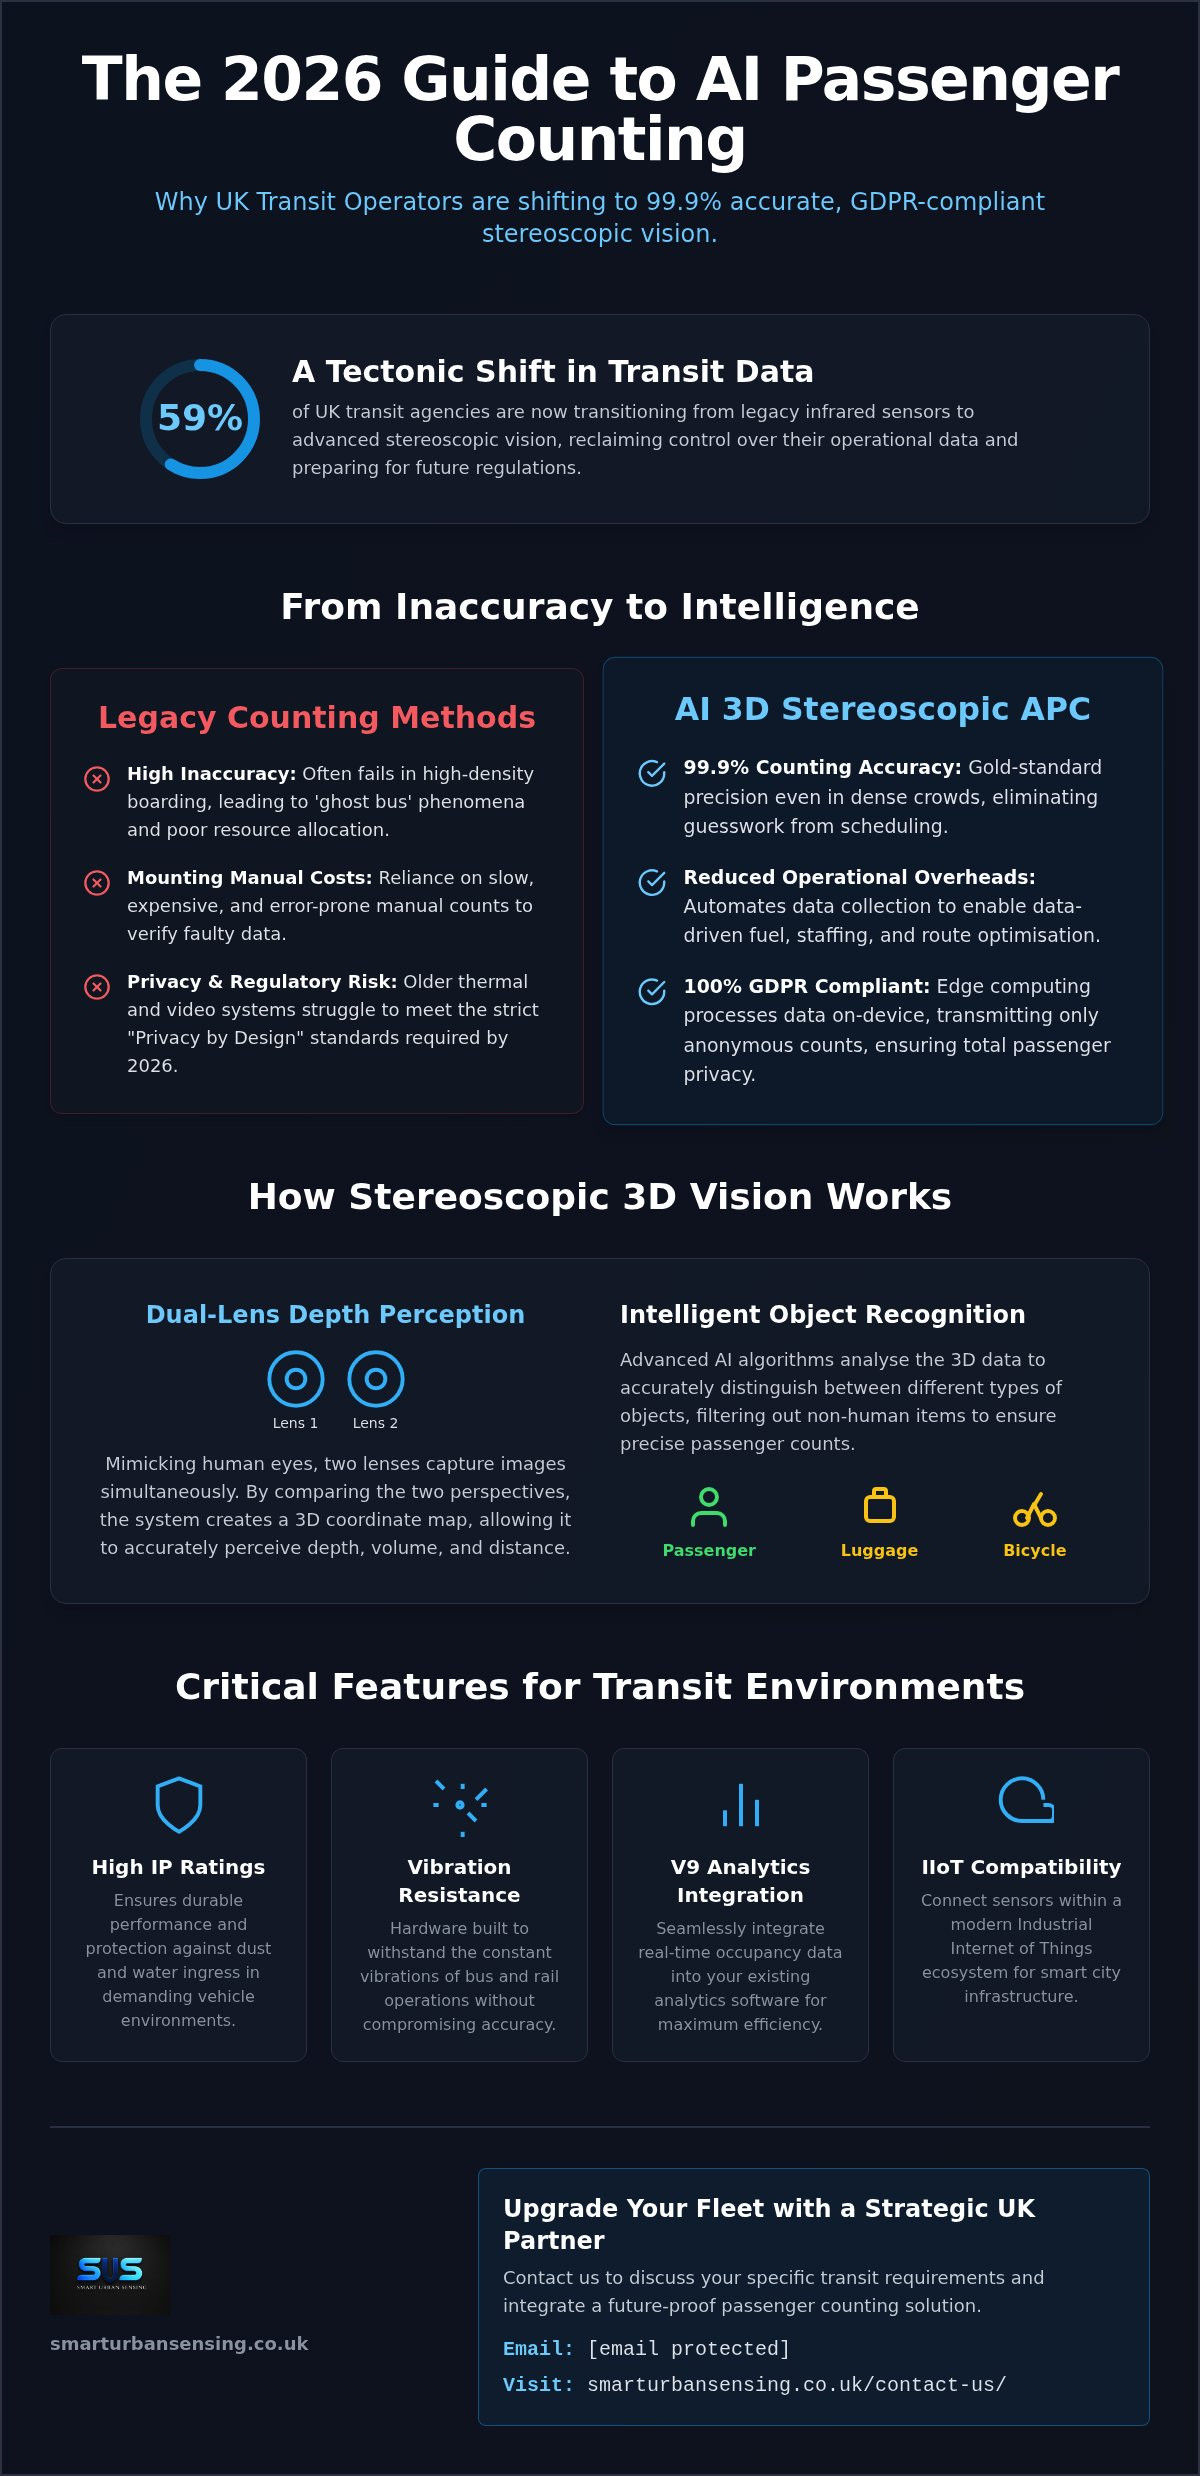
Our 2026 buying guide covers accuracy and validation, sensors and vehicle fit, gateway and connectivity, integration, privacy and the questions to put to any APC supplier.
Integration and privacy
Your systems, and a data map your DPO can read in a minute
Where the data goes
- REST API. The same records the console reads — counts, occupancy, trips, stops, sensor health.
- MQTT subscription. Ingest the live stream yourself with your own credentials.
- Fleet management. Occupancy and boardings into your existing FMS for allocation and duty planning.
- Passenger app. Full, Almost Full or Low occupancy published to your live bus app.
- Exports. PDF, Excel and CSV on a schedule, or delivery to a warehouse or SFTP endpoint.
- Open by preference. Where your estate follows an open onboard architecture such as ITxPT, we will map to it rather than against it — and we never hold ridership data hostage to a dashboard licence.
What is and is not personal data
- Counting runs on the device. Overhead 3D sensors emit counts, not images.
- No passenger images are stored or transmitted for counting.
- No facial recognition, and no identification of individuals.
- No personally identifiable data is carried in MQTT messages.
- No per-passenger or per-user licence fees.
- Any on-board CCTV you operate stays under your own policy and retention schedule, entirely separate from counting.
For anonymous counting alone a full DPIA is usually not required — but the screening decision should be documented, and we provide wording you can use. Retention, lawful basis and access roles are agreed per contract and documented at handover.
Deployment
Staged, so you hold evidence before you commit a fleet
1. Vehicle survey
To begin with, we survey door geometry, header clearance, mounting positions, cable routes, power and a secure gateway location. The validation plan is agreed here, before anything is ordered.
2. First-article install
One vehicle fitted: a counter above each boarding point, gateway in the secure equipment area on vehicle power, SIM fitted, cabling made good.
3. Commissioning
Sensor identities, topics and credentials configured, TLS certificates issued, cloud data confirmed end to end before the vehicle returns to service.
4. Validation
Next, counts are checked against manual observation per door and per route, then recorded and signed. You hold that record before any fleet commitment.
5. Fleet roll-out
After that, a repeatable per-vehicle build follows a documented specification, scheduled around depot availability so vehicles come off the road once, briefly.
6. Handover and support
Finally, console training for your operations and planning teams, credential rotation before go-live, as-built documentation and support terms against your operating hours.
Questions operators actually ask
Straight answers
Counting and accuracy
Is an automated passenger counter the same as an APC?
Yes. APC stands for automatic or automated passenger counting, and an automated passenger counter is the device that does it — counting boardings and alightings at the door without any driver action or fare transaction. The AI 3D APC is our automated passenger counter for buses, trams, tubes and trains.
What counting accuracy will we get?
We work to 99% per door and prove it rather than assert it. Accuracy depends on door geometry, mounting height and passenger behaviour on your vehicles, so we agree a validation plan before installation and record the measured result per door and per route. Any supplier quoting a single fleet-wide percentage before seeing your vehicles is quoting a brochure, not your service.
Do you record or store images of passengers?
No. Overhead 3D sensors process on the device and emit counts only — no passenger images are stored or transmitted for counting, there is no facial recognition, and no personal data is carried in MQTT messages. Any on-board CCTV you operate is separate and stays under your own policy.
Does it work without a fare system or driver input?
Yes, and that is the point. Counting is entirely independent of ticketing and of any driver action, so it produces a defensible ridership figure that includes concessionary travellers, pass holders and everyone who never taps.
How does it handle two people boarding together?
Depth separation resolves overlapping bodies as distinct height profiles rather than a single mass, which is the failure mode that inflates or deflates beam and single-camera counters at peak boarding.
Are children counted?
That is your policy, not the sensor's. Height thresholds are configurable per operation and applied consistently across the whole fleet.
Data, connectivity and rollout
What happens when a vehicle loses signal?
Messages queue on the vehicle and arrive when the connection returns, keeping their source timestamps. Feed-liveness rules flag a stale feed and then an offline vehicle, so an outage shows up as an outage rather than as a quiet day.
Can we get the raw data out?
Yes — REST API, direct MQTT subscription, and PDF, Excel or CSV exports. Scheduled delivery into your warehouse or an SFTP endpoint is scoped per contract.
Can it go on trams, tubes or trains?
Yes. The unit is a compact, low-power, vibration-proof design intended for buses, trams, tubes and trains, with high-ceiling coverage options where the mounting height is greater.
Can we speak to an existing operator?
Yes, under NDA during a live tender. Our reference deployment is a live bus operation running on this platform in daily service; we keep the operator and route detail confidential until they agree otherwise.
Free consultation
Talk to us before the specification is written
The cheapest time to fix an APC procurement is before the ITT goes out. Tell us the fleet, the doors per vehicle and what you need the data to prove, and we will come back with a system design, a validation plan and a written scope.
A system design for your fleet
- Counter positions and quantity per vehicle type, with mounting and cabling implications
- Gateway, connectivity and topic design, including what happens in tunnels and dead spots
- A validation method and acceptance threshold written down before installation
- Integration route into your FMS, ETA app and reporting
- A staged delivery plan you can put through procurement
APC specification checklist
A scoreable requirement checklist you can lift straight into an ITT — accuracy and validation, sensors and vehicle fit, gateway and connectivity, the data platform, integration, security, privacy, reporting and support. Supplier-neutral: it works against any APC vendor, including ones that are not us.
Request a free consultation
Tell us where to reach you and we will come back the same working day. No follow-up sequence you cannot escape.
Prefer to talk it through? Email sales@smarturbansensing.co.uk or use the contact page.
Counting you can audit, on hardware built for the vehicle.
We will review your draft specification, tell you which lines are unenforceable, and say plainly where our own system would not meet them.